Disclaimer: The content provided in this article is intended for general informational purposes only and should not be construed as financial advice. The analysis presented is based on cyclical patterns in historical revenue data, which may not be applicable to specific financial situations or investment decisions. Readers are advised to conduct their own research and consult with qualified financial professionals before making any investment or business choices. The author and Cycle Quest shall not be held responsible for any losses, damages, or liabilities resulting from the use of the information presented in this article. Additionally, past performance or historical trends are not indicative of future results. Individual circumstances and market conditions may vary, so exercise caution and judgment when applying the insights discussed in this article.
In the fast-paced world of finance, where fortunes can be made and lost in the blink of an eye, one key indicator stands tall, casting its influence over Wall Street like a sentinel of market sentiment – the VIX, also known as the Volatility Index. The VIX holds a crucial role in measuring market volatility and is often referred to as the “investor fear gauge.” Why? Because it helps traders and investors anticipate potential panic situations.
However, in the ever-shifting landscape of financial markets, mere observation of the VIX index might not be enough to navigate the twists and turns with confidence. This is where cyclical analysis steps into the limelight, armed with the power to decode the hidden patterns and cycles within market data. By leveraging cyclical analysis, traders gain a unique advantage – the ability to foresee the ebbs and flows of the VIX, which can be instrumental in making well-informed decisions.
In this article, we delve into the fascinating world of cyclical analysis and its invaluable application in anticipating movements in the VIX index. We aim to illuminate the path for traders seeking to forecast panic moments on Wall Street and understand how these predictions can significantly impact the stock market.
The VIX index is a measure of the market’s expectation of near-term volatility.
Cyclical analysis can be used to identify patterns that point to potential intraday peaks in the VIX index.
Cycle Quest provides comprehensive advisory services for traders and investors seeking to utilize cyclical analysis for greater success in financial markets. Contact us today for more information.
Table of Contents
Understanding Cyclical Analysis and its Importance
In the ever-evolving realm of financial markets, understanding cyclical analysis and its implications can provide a significant edge to traders and investors. Cyclical analysis is the process of identifying repeating patterns or cycles within market data, unveiling the hidden rhythms that govern asset price movements. By recognizing these patterns, market participants gain valuable insights into potential future trends and can make more informed decisions.
The relevance of cyclical analysis in financial markets lies in its ability to decipher the often elusive nature of market behavior. While markets can appear chaotic and unpredictable, cyclical analysis helps bring a sense of order by revealing recurring patterns. By understanding these cycles, traders can anticipate the probable direction of price movements and make timely adjustments to their strategies.
Identifying cycles in market data offers several crucial benefits. First and foremost, it allows traders to gain a deeper understanding of market sentiment and investor behavior. Cycles can be influenced by a wide range of factors, such as economic events, geopolitical developments, and market sentiment. By pinpointing these cycles, traders can better comprehend the forces at play, leading to more astute decision-making.
Moreover, cyclical analysis provides a valuable perspective on market trends over different timeframes. Whether it’s short-term intraday movements or longer-term trends, recognizing cycles can shed light on the market’s broader trajectory. This information can help traders adjust their positions accordingly and optimize their risk-reward ratios.
The success of cyclical analysis in financial markets has been demonstrated time and again. Throughout history, various financial markets have exhibited cyclical patterns that repeated with remarkable consistency. These cycles often span different durations, from daily fluctuations to yearly oscillations. Traders who grasp the power of cyclical analysis can exploit these recurrent patterns to their advantage.
For instance, the stock market has witnessed cycles of bull and bear markets, where periods of sustained growth are followed by sharp downturns. By identifying these cyclical patterns, investors can proactively adjust their portfolios, aiming to capitalize on favorable market conditions and safeguard their assets during downturns.
Similarly, commodities markets, foreign exchange, and other financial instruments exhibit their unique cycles, driven by factors specific to their respective industries. Astute traders who incorporate cyclical analysis into their toolbox can seize opportunities arising from these cyclical dynamics.
Spotting Downtrend Moments in the VIX Index
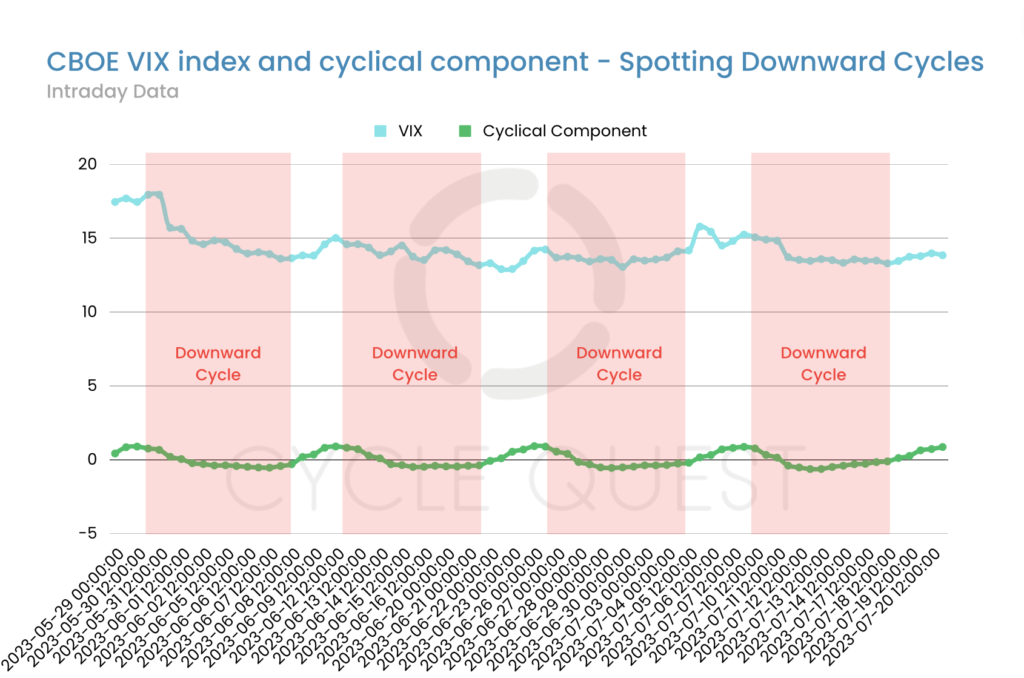
The first chart presents a fascinating visual representation of the VIX index data, unveiling its downtrend moments. Downtrends in the VIX index signify periods of relative market stability, where investors display confidence and the fear of volatility diminishes. Let’s explore the key characteristics of these downtrends and how cyclical analysis plays a crucial role in identifying them in real time.
Key Characteristics of Downtrends in the VIX Index
During downtrend moments in the VIX index, several prominent features emerge:
Fear downtrends are marked by a gradual decline in the VIX index. This decline suggests that market participants perceive a reduction in uncertainty and fear, leading to lower volatility expectations.
Fear downtrends often encounter support levels, where the VIX index finds temporary stability before resuming its downward trajectory. Identifying these support levels is essential for gauging potential turning points in the trend.
As the downtrend progresses, the VIX index forms lower highs and lower lows. This pattern indicates a weakening in market fear and suggests that the likelihood of panic-induced events decreases.
Downtrends in the VIX index are indicative of a growing sense of investor confidence in the market’s stability. As fear subsides, investors may become more willing to take on risks, leading to bullish sentiment in the broader market.
How Cyclical Analysis Identifies Downtrend Moments
Cyclical analysis is a powerful tool for identifying downtrend moments in the VIX index with precision. By analyzing historical price data and patterns, cyclical analysis seeks to uncover cycles that repeat over time. This approach helps traders anticipate when downtrends may occur and make timely decisions.
During downtrends, cyclical analysis will identify specific price patterns and data sequences that align with previous downturns in the VIX index. These patterns may involve the convergence of various technical indicators and trendlines. As the cyclical patterns emerge, traders can anticipate a potential downtrend, allowing them to adjust their strategies accordingly.
Moreover, cyclical analysis excels at providing real-time insights. As the VIX index data unfolds, cyclical patterns can be continuously updated, alerting traders to any deviations from historical norms. This agility empowers traders to respond swiftly to changes in market sentiment and make informed decisions as downtrends materialize or shift direction.
In summary, the first chart highlights the characteristics of downtrend moments in the VIX index, indicating reduced fear and heightened investor confidence. Cyclical analysis serves as an invaluable ally, leveraging historical patterns to help traders identify these downtrends in real time.
With this knowledge, traders can make better-informed decisions, whether to capitalize on bullish opportunities or exercise caution during periods of market stability. With this understanding of downtrends, let’s move forward to the next chart, where we will explore the contrasting uptrend moments in the VIX index and how cyclical analysis plays a vital role in spotting them.
Spotting Uptrend Moments in the VIX Index
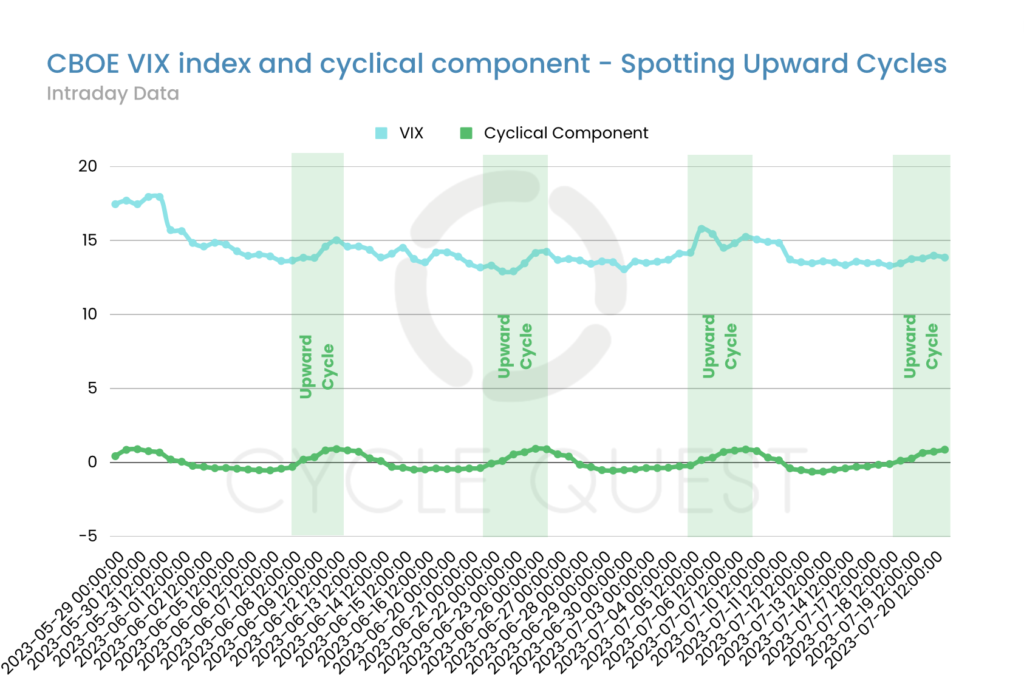
As we venture further into the realm of the VIX index, the second chart unveils a captivating visualization of its uptrend moments. Uptrends in the VIX index signify rising market volatility, reflecting increased fear and uncertainty among investors. Let’s explore the crucial indicators of these uptrend moments and how cyclical analysis becomes instrumental in timely recognizing them.
Crucial Indicators of Uptrends in the VIX Index
During uptrend moments in the VIX index, several key indicators emerge:
Fear uptrends are characterized by a sudden surge in the VIX index. This rapid surge suggests heightened market uncertainty and an increasing fear of volatility.
Fear downtrends often encounter support levels, where the VIX index finds temporary stability before resuming its downward trajectory. Identifying these support levels is essential for gauging potential turning points in the trend.
As the uptrend progresses, the VIX index forms higher highs and higher lows. This pattern suggests that fear is mounting in the market, and the potential for panic-induced events may be on the rise.
Uptrends in the VIX index signify heightened market fear and growing risk aversion among investors. As the fear gauge surges, investors may become more cautious, leading to bearish sentiment in the broader market.
How Cyclical Analysis Aids in Timely Recognition of Uptrend Moments
Cyclical analysis proves its mettle yet again by aiding in the timely recognition of uptrend moments in the VIX index. By analyzing historical price data and patterns, cyclical analysis identifies cycles that repeat during periods of rising volatility. This analytical approach empowers traders to anticipate potential uptrends and make well-timed decisions.
As the VIX index data unfolds, cyclical analysis constantly updates its findings, seeking patterns that match previous uptrends. These patterns may encompass a convergence of technical indicators, chart formations, and trendlines. By identifying these cyclical signals, traders gain a crucial edge in anticipating potential uptrends and their possible magnitude.
Moreover, cyclical analysis excels at capturing real-time market dynamics. As market sentiment shifts and new data becomes available, cyclical analysis adapts, alerting traders to any deviations from historical norms. This adaptability allows traders to respond swiftly to evolving market conditions and adjust their strategies accordingly.
Therefore, the second chart reveals the indicators of uptrend moments in the VIX index, signifying mounting fear and increased volatility expectations. Thanks to cyclical analysis, traders can spot these uptrends in a timely manner, leveraging historical patterns to make well-informed decisions. Armed with this knowledge, traders can navigate periods of rising volatility with confidence, seizing potential bearish opportunities or safeguarding their positions.
The Power of Cyclical Analysis: Backtesting with VIX Index Data
In the quest to forecast panic moments at Wall Street, the power of cyclical analysis shines through in the process of backtesting. Backtesting involves using historical VIX index data to evaluate the effectiveness of cyclical analysis in predicting future VIX movements. Let’s delve into this fascinating process, explore the third chart, and understand how cyclical analysis can empower traders with the foresight to navigate the intricate web of financial markets.
The Process of Backtesting
Backtesting is a rigorous and data-driven approach that assesses the viability of trading strategies using historical data. In the context of cyclical analysis, backtesting involves applying cyclical principles to past VIX index data, identifying cyclical patterns, and using them to predict future price movements. By examining how well these predictions align with actual market performance, traders can gain insights into the reliability of cyclical analysis.
This iterative process requires the formulation of specific rules based on cyclical patterns. These rules guide traders in determining entry and exit points for trades based on anticipated VIX movements. Once these rules are established, they are then applied to historical VIX index data to simulate trading performance. By analyzing the results of these simulations, traders can fine-tune their strategies and gain confidence in the predictive power of cyclical analysis.
Demonstrating Cyclical Analysis’s Ability to Anticipate VIX Movements
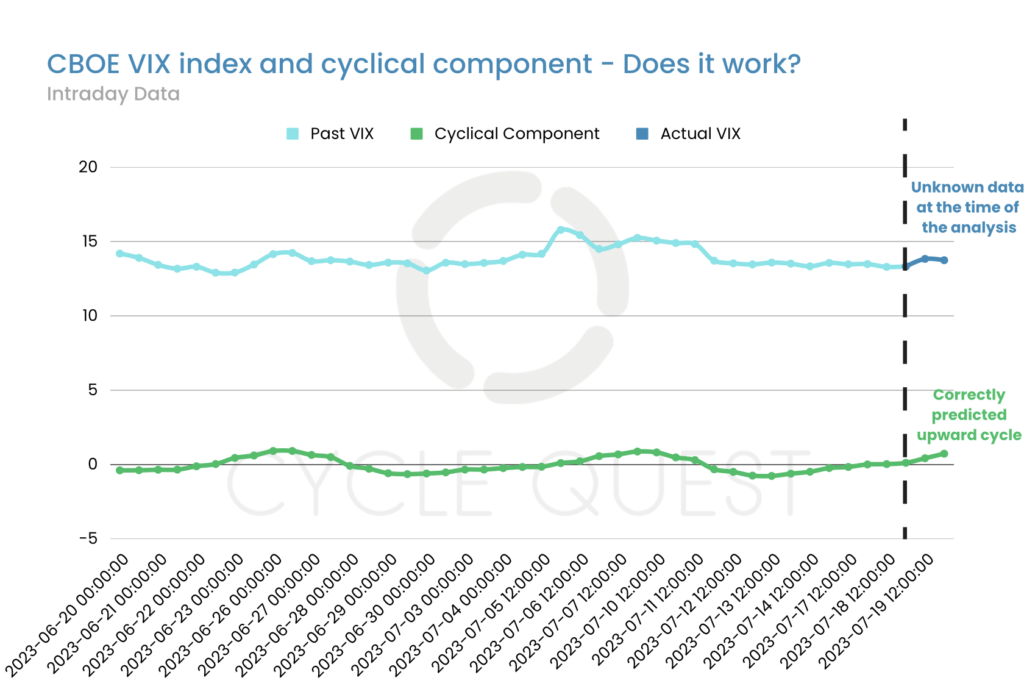
The third chart is a testament to the prowess of cyclical analysis, illustrating its capacity to anticipate VIX movements with precision. The chart showcases a predicted VIX increase from, for instance, 13 to 14. While this may appear as a minor fluctuation, it holds immense significance for the stock market and investors.
The Predicted VIX Increase and its Potential Impact on the Stock Market
While a seemingly subtle movement, an increase in the VIX from 13 to 14 implies a rising level of market fear and uncertainty. Such a change may indicate a shift in investor sentiment, with growing concerns over potential volatility and risk. As the VIX rises, stock market participants may adopt a more cautious approach, leading to a decreased appetite for risky assets and potential declines in stock prices.
It’s crucial to acknowledge that even seemingly minor changes in the VIX can have cascading effects across the stock market. Investors may adjust their portfolios in response to these changes, influencing asset prices and overall market sentiment. Therefore, recognizing and interpreting these subtle movements can be a game-changer for traders seeking to anticipate potential panic situations.
The Importance of Recognizing Seemingly Subtle Movements in the VIX Index
In the dynamic world of finance, seemingly minor fluctuations can often hold vital clues about future market movements. By honing their skills in recognizing these subtle changes, traders can stay ahead of the curve and make informed decisions in an ever-changing landscape.
Cyclical analysis excels in identifying these subtle movements and provides traders with a comprehensive understanding of the underlying market dynamics. Armed with this insight, traders can position themselves strategically, mitigating risks during periods of rising volatility and capitalizing on opportunities in times of market stability.
The third chart and the process of backtesting demonstrate the remarkable abilities of cyclical analysis to anticipate VIX movements. Even seemingly minor changes in the VIX index, like a move from 13 to 14, can have significant implications for the stock market. Recognizing these subtle movements empowers traders to make informed decisions, navigate volatility with confidence, and proactively prepare for potential panic situations on Wall Street. As we prepare to move toward the last chart we’ll examine today, we are poised to explore the fascinating world of intraday peaks in the VIX index and the intriguing insights offered by cyclical analysis.
Forecasting the Next Intraday Peak in the VIX Index
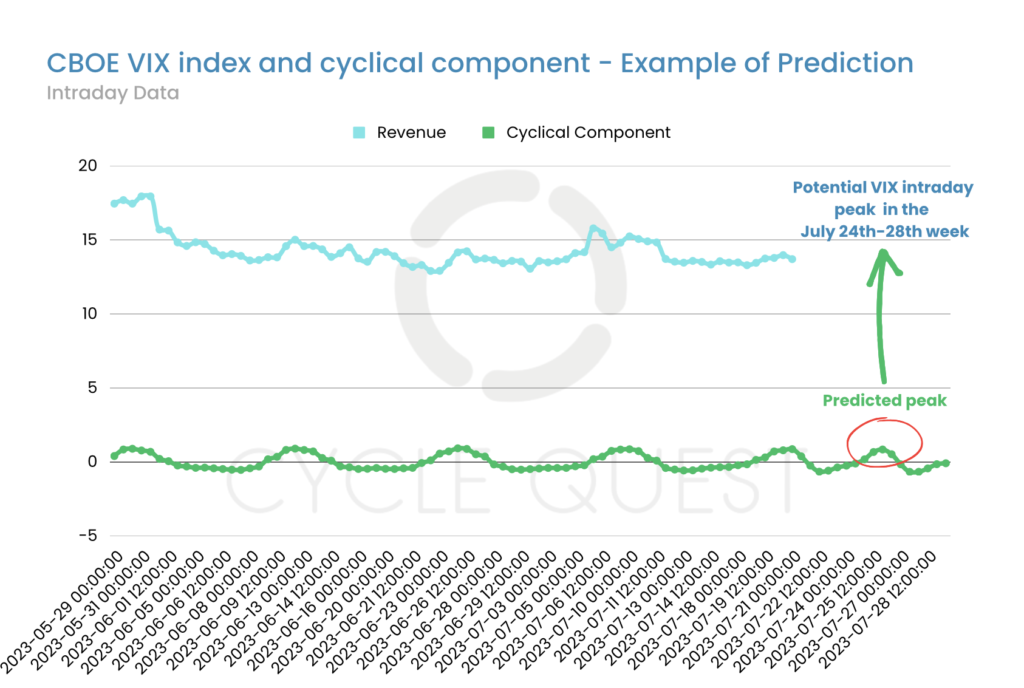
The fourth chart offers a compelling glimpse into the future, forecasting the potential next intraday peak in the VIX index. Intriguingly, the analysis suggests that this peak is likely to occur between July 24th and July 28th. Let’s embark on this enlightening exploration, uncover the analysis behind this prediction, and understand the significance of intraday peaks in the VIX index for market participants.
Forecasting the Intraday Peak
This last chart presents a carefully constructed analysis of VIX index data, unveiling a pattern that points to the likelihood of an intraday peak in the near future. Cyclical analysis, as a guiding force, utilizes historical data to identify recurring patterns that may foreshadow future movements.
The analysis indicates that the VIX index is poised to experience an upward surge, reaching an intraday peak within the specified timeframe. While the magnitude of the increase may vary, the significance lies in recognizing the potential shift in market sentiment and increased volatility.
Understanding the Intricacies of Intraday Peaks in the VIX Index
Intraday peaks in the VIX index are moments of intense market fear and uncertainty that transpire within a single trading day. These peaks indicate sudden and sharp increases in volatility expectations, often triggered by unexpected events or news that profoundly impact investor sentiment.
For market participants, intraday peaks are crucial moments to monitor closely. They offer valuable insights into the market’s immediate response to unfolding events, shedding light on the intensity of investor fear and their willingness to embrace risk. The rapid and drastic changes during intraday peaks can have profound implications for short-term trading strategies and decision-making.
Implications for Market Participants
Intraday peaks in the VIX index serve as a crucial warning sign for traders and investors to exercise caution and reassess their risk management strategies. The heightened volatility may lead to sudden and large price swings, necessitating the implementation of prudent risk control measures.
For traders with the capacity to act quickly, intraday peaks offer potential opportunities for short-term trades. By capitalizing on the sharp price movements, traders can exploit market dislocations and make swift profits during periods of heightened volatility.
Intraday peaks not only reflect immediate market sentiment but may also serve as a signal for broader market conditions. Sharp increases in the VIX index may indicate the beginning of a more prolonged uptrend, signaling a shift in market dynamics.
The Value of Cyclical Analysis in Forecasting Intraday Peaks
Cyclical analysis plays a pivotal role in forecasting intraday peaks by detecting patterns that have historically foreshadowed such events. The ability to anticipate these peaks can help traders stay one step ahead, allowing them to act decisively and strategically in response to rapidly evolving market conditions.
The last chart we studied offers an intriguing glimpse into the future, predicting the potential next intraday peak in the VIX index between July 24th and July 28th. Intraday peaks hold immense significance for market participants, guiding their risk management strategies and presenting opportunities for profitable short-term trades.
By harnessing the power of cyclical analysis, traders can unlock the secrets of these peaks and gain a competitive edge in navigating the ever-changing landscape of financial markets. As we conclude our journey through the world of cyclical analysis and its impact on forecasting panic at Wall Street, we leave with a newfound appreciation for the art of deciphering market patterns and making well-informed decisions.
Practical Applications of Cyclical Analysis for Traders and Investors
Cyclical analysis benefits traders and investors by:
Recognize patterns in the VIX index and other assets to time entry and exit points effectively.
Use multiple tools to validate signals and gain a comprehensive market understanding.
Gauge investor fear and confidence for timely decision-making.
However, there are risks and limitations, including data interpretation errors, changing market conditions, false signals, and backtesting limitations. Traders must stay adaptive and corroborate predictions with other analytical methods for greater reliability. By skillfully integrating cyclical analysis into their strategies, traders can navigate financial markets with confidence and seize opportunities.
Cycle Quest – Your Partner in Cyclical Analysis
In this article, we have explored how cyclical analysis can help you understand financial market movements. For personalized cyclical analysis services tailored to businesses, investors, and curious learners’ needs, Cycle Quest offers a simple 3-step process:


Discover the power of cyclical analysis in diverse areas like business, investments, sports, and science. Let Cycle Quest be your trusted guide, unraveling hidden cyclical patterns within your data. Gain a competitive edge and optimize your strategies by contacting us today.


One thought on “Using Cycle Analysis to Forecast Panic at Wall Street”
Comments are closed.