In so many fields, understanding shifts in public opinion is crucial. In this article, we will explore the power of cyclical analysis in predicting opinion shifts by using YouGov’s US Congress Approval Rate as an example. It’s essential to emphasize that this analysis is non-partisan, aiming solely to showcase the effectiveness of cyclical analysis on opinion polls.
By focusing on both the overall population and the younger demographic, we aim to highlight potential divergences in opinion trends. Through the examination of six informative charts, we will provide insights into approval and disapproval rates among all adults and those under 30. Additionally, we will demonstrate how cyclical analysis can offer predictive value by forecasting future trends in the way US voters approve or disapprove what the Congress does.
The article highlights how cyclical analysis can effectively predict shifts in public opinion in the political world. By examining YouGov’s US Congress Approval Rate through cyclical patterns, we can gain valuable insights into the dynamics of approval and disapproval rates among all adults and the under-30 demographic.
The analysis considers the opinions of both the overall population and young adults separately, shedding light on potential divergences in opinion trends. This nuanced approach allows for a comprehensive understanding of how public sentiment towards the US Congress evolves over time.
For those interested in leveraging the power of cyclical analysis, Cycle Quest offers expertise in this field. Our team can provide you with specialized insights and predictive capabilities to understand and anticipate opinion shifts in the political landscape. Contact us to begin your journey with us and unlock the potential of cyclical analysis for your own research and decision-making processes.
Table of Contents
Disapproval Rate for the US Congress Among All Adults
The first chart presents the cyclical behavior of the US Congress Approval Rate, specifically focusing on the disapproval rate among all adults (note that the data looks at the Congress as a whole, with no distinction between the republican and democratic party). What makes this analysis truly remarkable is the stunning resemblance between the cyclical component and the actual data. By carefully identifying and tracking recurring patterns in public sentiment towards Congress, we can glean valuable insights into the underlying dynamics driving approval and disapproval rates.
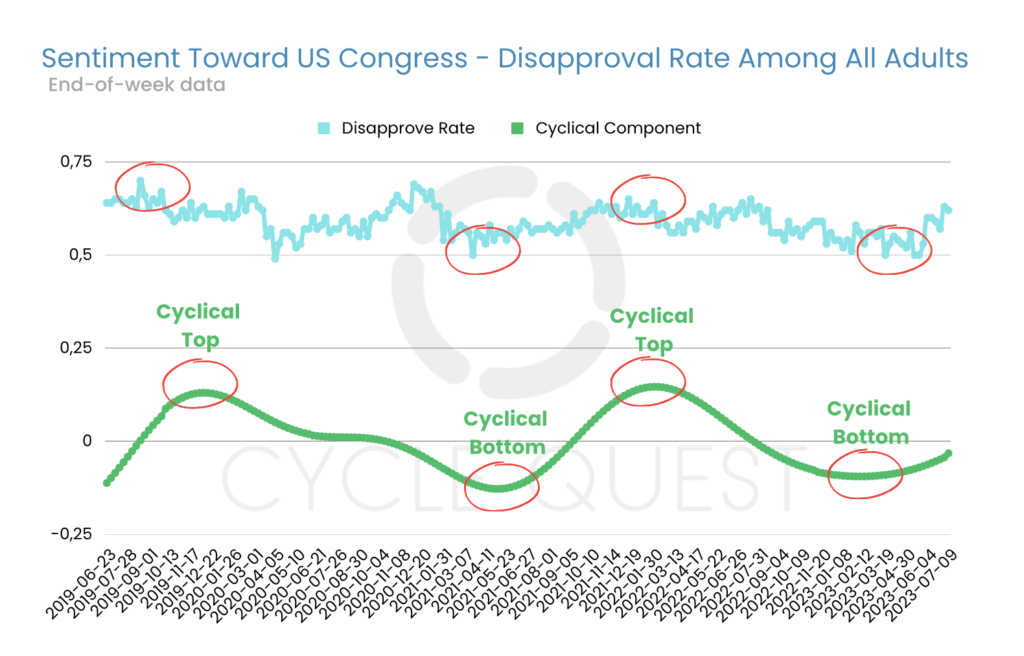
The cyclical component acts as a powerful lens through which we can understand the ebb and flow of public opinion over time. It uncovers hidden movements and recurring shifts that may not be immediately apparent when looking at raw data alone. This deeper level of understanding allows us to make more informed predictions about future opinion shifts and helps us navigate the complexities of the political landscape with greater confidence.
In essence, this analysis demonstrates that there is an inherent rhythm to how the public perceives the US Congress (with direct consequences on the US president as well). The cyclical patterns revealed through our analysis provide a unique perspective on the evolution of sentiment, which is invaluable for policymakers, researchers, and anyone seeking to comprehend the underlying factors shaping public approval and disapproval of the US Congress.
Understanding these cyclical patterns not only helps us grasp the present but also holds the potential to anticipate future shifts in approval rates. This predictive power is crucial for making informed decisions and crafting effective policies that resonate with the ever-changing sentiments of the population.
Congressional Approval Rate Among All Adults
The second chart serves as a valuable complement to the first, offering insights into the approval rate among all adults. By examining both the approval and disapproval rates together, we gain a more comprehensive understanding of the fluctuations in public perception towards the US Congress.
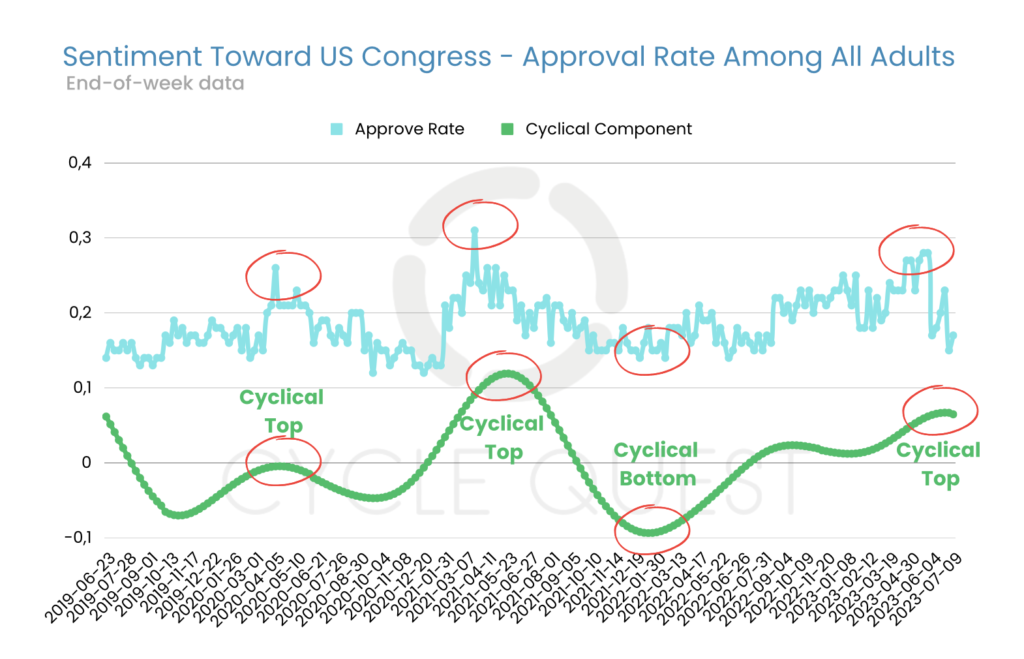
What sets this analysis apart is the discovery of a highly compelling correlation between the active aggregated cycle and the actual data. The resemblance between the cyclical patterns and the real-world approval rate data further bolsters the credibility of our cyclical analysis approach.
This correlation opens up new avenues for exploration, as we can now discover how approval and disapproval rates interact with each other within the broader cyclical framework. The insights gained from this correlation can provide us with a more holistic view of the factors influencing public sentiment towards the US Congress.
A high correlation between the active aggregated cycle and the actual approval rate underscores the relevance of cyclical analysis in gauging public sentiment accurately. It implies that the cyclical patterns are not mere coincidences but reflect underlying forces that influence how people perceive the performance of the US Congress over time.
Having a robust understanding of both approval and disapproval trends empowers decision-makers to craft policies and messages that resonate with the public. By observing the cyclical nature of these trends, we can better anticipate when approval rates may increase or decrease and adjust our strategies accordingly.
Therefore, the second chart’s strong correlation between the active aggregated cycle and the actual approval rate data deepens our understanding of how public perception evolves over time. This powerful correlation is yet another proof of the value of cyclical analysis in political research and underscores its relevance in predicting opinion trends.
If you can predifct how many people think the US congress is handling its job in a good way, your understanding of the present “bigger picture” becomes clearer. And don’t be fooled: the same concepts apply to understanding how the number of persons who disapprove of the way the US Congress operates work changes over time.
By utilizing this knowledge, we can develop more nuanced strategies, policies, and communications that resonate with the ever-changing sentiments of the population, driving us toward a more informed and cohesive political landscape.
Disapproval Rate Among Americans Under 30 Years Old
Understanding that young people often hold distinct views compared to the overall population, our analysis delves into the disapproval rate among the under-30 demographic. By focusing on this specific age group, we gain valuable insights into the unique patterns and trends that shape their perception of the US Congress.
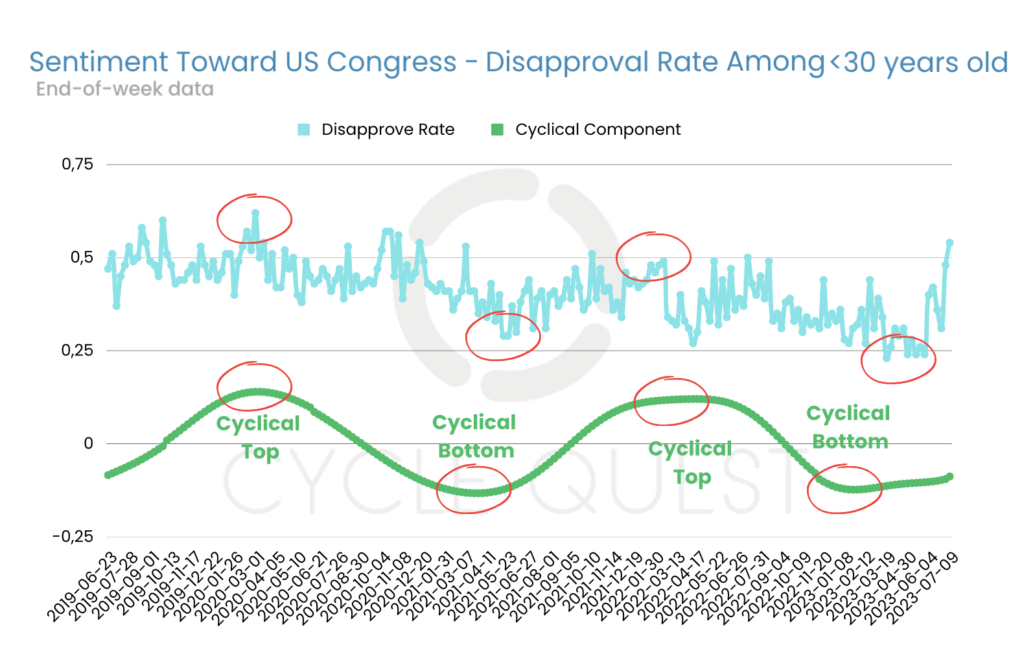
Remarkably, once again, we observe a clear cyclical pattern in the indicator. The presence of this cyclical behavior among the younger demographic reaffirms the relevance of cyclical analysis in capturing shifts in public sentiment across different segments of the population.
As we uncover these cyclical patterns, we gain a deeper understanding of how the US Congress’s performance is perceived by the younger generation. Such insights are essential, as young adults often represent the future electorate and have a significant impact on shaping the political landscape in the years to come.
The cyclical patterns observed among the under-30 demographic may differ from those among the overall population. These distinctions are essential to consider when developing policies and communication strategies targeted specifically at young adults. By recognizing the cyclical nature of disapproval rates among the under-30 demographic, we can tailor messages and initiatives that better resonate with their evolving perspectives.
Moreover, this cyclical analysis provides a powerful tool for forecasting potential changes in the disapproval rate among young adults. Anticipating these shifts allows us to adapt our outreach efforts and political engagement to better align with the priorities and concerns of this crucial segment of the population.
Poll – Congress Approval Rate Among Under 30 Years Old
The fourth chart mirrors the third, showing the approval rate among individuals under 30. This data helps us identify disparities between the opinions of young adults and the general public.
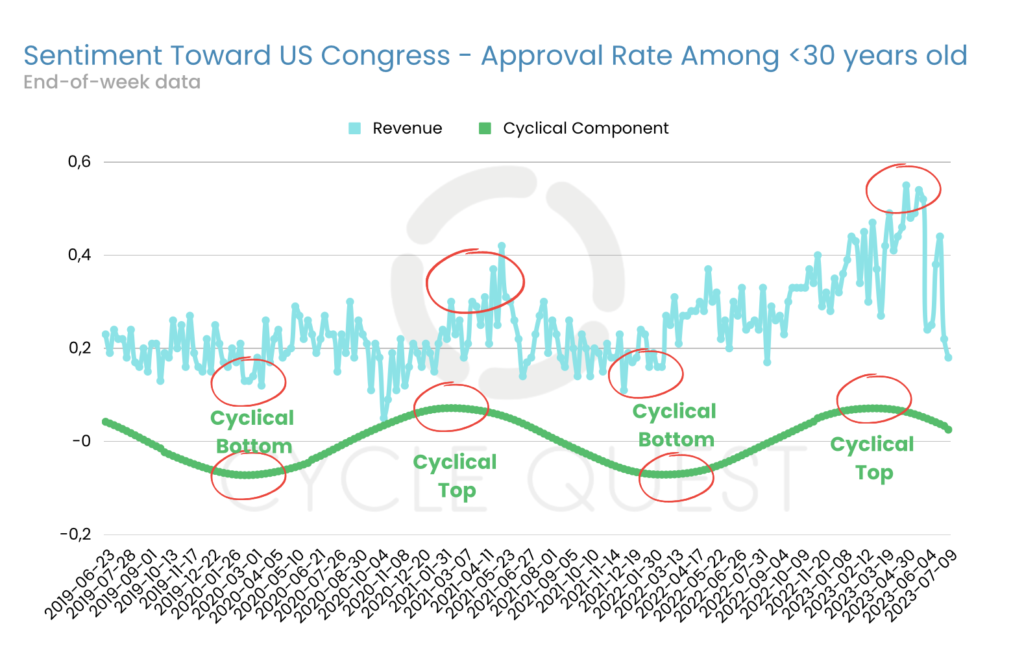
Notably, the cyclical component is evident in this indicator as well. The presence of cyclical patterns in the approval rate among young adults further reinforces the significance of cyclical analysis in understanding the dynamics of public sentiment within specific age groups.
By observing these cyclical trends, we can gain valuable insights into how the younger generation perceives the performance of the US Congress over time. This knowledge is crucial for tailoring policies and communication strategies that better resonate with the unique perspectives and concerns of young adults.
Predictive Power of Cyclical Analysis – Identifying Uptrend with the United States Congress Popularity
Prepare to be amazed by the remarkable predictive capacity of cyclical analysis! Our fifth chart presents undeniable evidence of its accuracy and foresight. With the power of our cutting-edge methodology and applying it to historical data, we successfully forecasted the onset of an uptrend in the disapproval rate (for both the senate and the house of representatives) among all adults as early as November 2021.
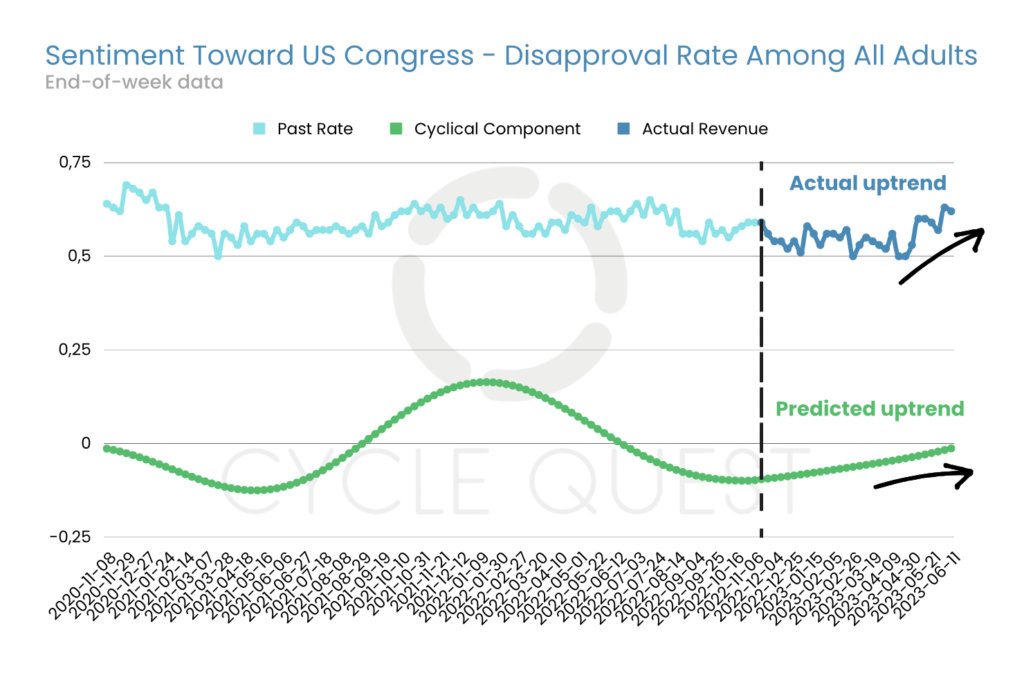
Imagine the advantage of knowing the direction of public sentiment ahead of time. While the US Congress Approval Rate remained stable throughout the entirety of 2022, our cyclical analysis had already foreseen the impending shift. And true to its predictions, the clear uptrend phase commenced in 2023, confirming the accuracy of our approach.
What’s truly remarkable is the gradual nature of this cyclical behavior. Over the course of almost three years, we observed just two distinct lows from November 2020 to June 2023. This slow evolution speaks volumes about the stability and reliability of our cyclical analysis. Unlike volatile indicators, public opinion does not shift abruptly; it evolves steadily over time, and our methodology expertly captures these subtle yet crucial changes.
Knowing when and where the tide of public opinion is turning is a game-changer for policymakers, researchers, and anyone navigating the political landscape. This predictive power empowers you to make informed decisions and devise proactive strategies that resonate with the ever-changing pulse of the nation.
Projecting the Peak Disapproval Rate
As we approach the final chart, the excitement builds as we set out to uncover when the disapproval rate towards the US Congress will reach its peak among all adults. Brace yourself for the power of cyclical analysis, as it points us toward a potential peak around February 2024.
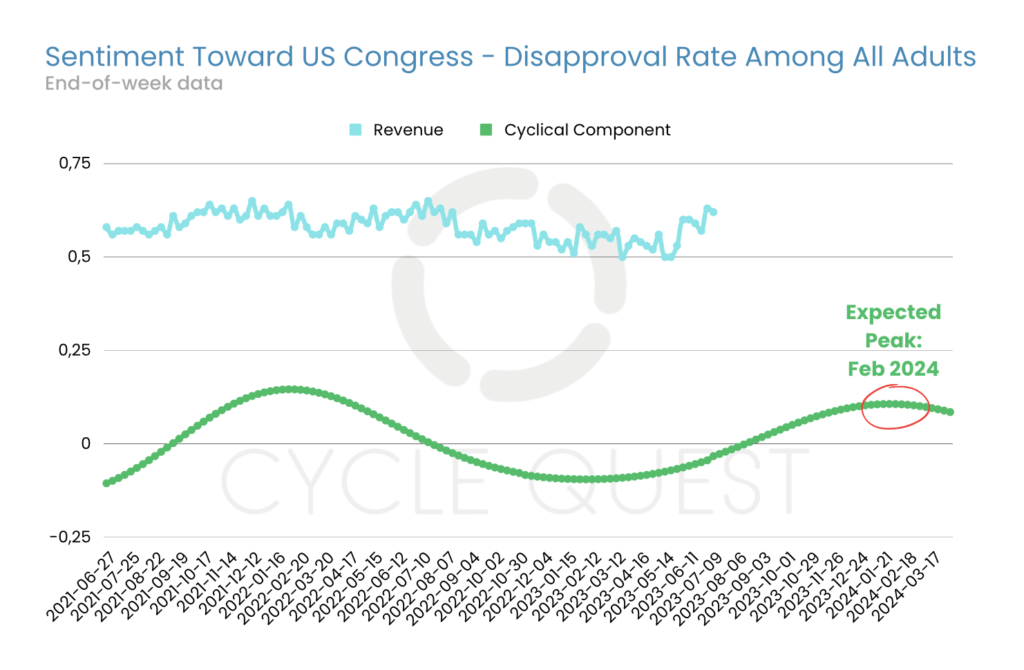
However, let’s be realistic – reaching this peak doesn’t necessarily signify an immediate decrease in disapproval. Public sentiment, like any significant change, requires time to evolve. We may witness a period of sideways movement before observing a genuine downward trend in disapproval rates.
Understanding the cyclical nature of public opinion empowers us to navigate through these transitional periods with confidence. We can prepare for potential challenges and seize opportunities that arise amidst the flux.
A significant factor that may play a pivotal role in shaping these trends is the 2024 presidential election scheduled for November (for any candidate involved in the campaign).
Presidential campaigns tend to be defining moments that sway public opinion and trigger shifts in approval and disapproval rates. The outcome of the election – with the choice between a democrat or a republican president – and the promises made during the campaign might prove to be influential factors in the post-peak landscape.
Cycle Quest – Your Partner in Cyclical Analysis
Cycle Quest is your go-to destination for personalized cyclical analysis services, expertly crafted to cater to the needs of businesses, investors, and curious learners. Our team of knowledgeable advisors possesses specialized expertise in diverse industries, enabling us to source and analyze the most relevant and valuable datasets for your unique requirements.
When reaching out to Cycle Quest, you’ll familiarize yourself with our simple 3-step process:


Reach out to us and discover compelling instances of cyclical analysis applications spanning various fields, such as business, investments, sports, and science.
With Cycle Quest as your trusted guide, delve into the concealed cyclical patterns within your data, unlocking a competitive edge and optimizing your strategies like never before.

