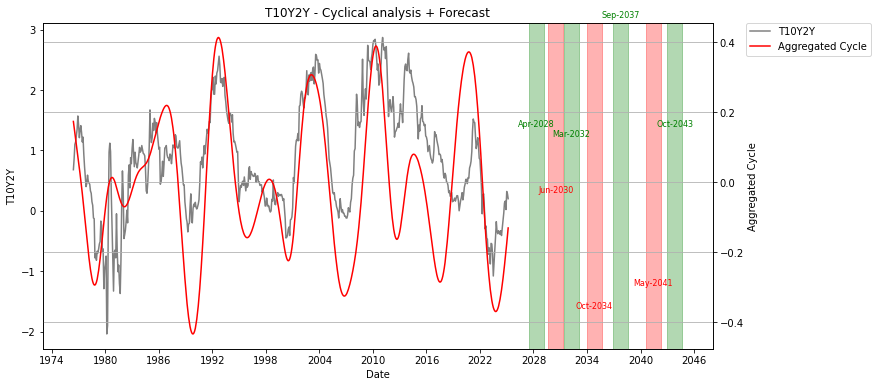
Wall Street is panicking about tariffs and Trump’s chaotic economic policies. Yet beneath the market turmoil lies a deeper, quieter signal—one rooted in the cyclical movements of the economy itself. Mark your calendars: the cycle says the yield curve spread peaks in April 2028.

As usual, the green areas are the next tops, and the red ones are the expected bottoms.
Recent weeks have seen Wall Street retreating, spooked by uncertainty around Trump’s incessant tariff threats. Investors hate unpredictability, and tariffs—especially those suddenly slapped onto major trading partners—create massive uncertainty. But while the market is currently focused on short-term fears, there’s a longer-term narrative that’s easy to overlook.
I’m talking about the yield curve, specifically the spread between 10-year and 2-year Treasury yields. This isn’t just a financial technicality. It’s an economic barometer with a track record of accurately forecasting economic shifts. And what it’s forecasting now is unmistakable: the spread is poised to rise steadily, reaching a cyclical peak around April 2028.
Initially, a widening spread suggests optimism—an expectation that growth or inflation will strengthen over the longer term. Given today’s bearish mood, driven by fears of Trump’s erratic trade wars, such optimism might seem improbable. But the cycle doesn’t care about headlines—it operates on predictable rhythms.
As investors fixate on Trump’s latest tweet-induced panic, they risk missing this critical cyclical signal. A rising yield curve today points toward economic stabilization, perhaps even renewed growth expectations once the current tariff-induced volatility passes. Ironically, just as markets may begin feeling confident again, that’s precisely when the risks are highest. By April 2028, exuberance will likely overshadow caution, making investors vulnerable to the inevitable cyclical downturn that follows.
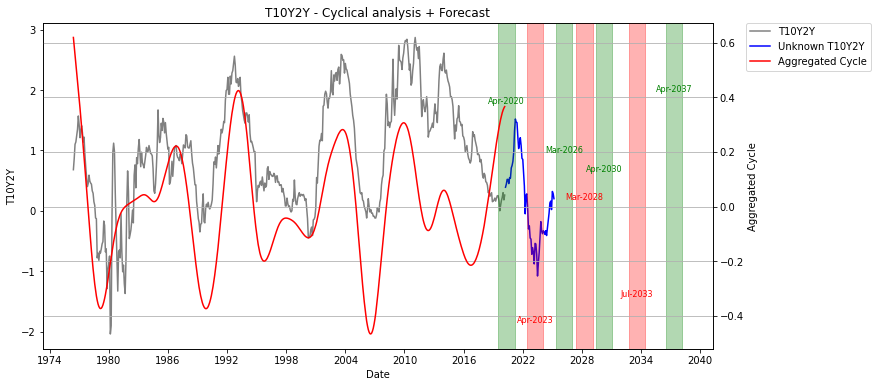
Does this kind of cycle analysis actually work? Yes—and convincingly so. Below, you’ll see a chart illustrating our model’s predictions from five years ago.

The blue line shows actual yield-curve data that our model had not yet seen. The red and green shaded areas mark the predicted cyclical tops and bottoms. As you can clearly observe, our analysis called a peak in the spring of 2020 and a subsequent bottom in spring 2023 with remarkable precision.
Policymakers and investors typically fail to see past today’s headlines. When April 2028 arrives, many will have long forgotten today’s tariff-induced anxieties, celebrating perceived economic resilience without realizing they’re standing at the cycle’s apex.
So, pay attention to the yield curve, remember April 2028, and don’t let short-term fears—or future complacency—blind you to the long-term cycle. History repeats itself, even if markets and policymakers rarely learn from it.

