Disclaimer: The content provided in this article is intended for general informational purposes only and should not be construed as financial advice. The analysis presented is based on cyclical patterns in historical data, which may not be applicable to specific financial situations or investment decisions. Readers are advised to conduct their own research and consult with qualified financial professionals before making any investment or business choices. The author and Cycle Quest shall not be held responsible for any losses, damages, or liabilities resulting from the use of the information presented in this article. Additionally, past performance or historical trends are not indicative of future results. Individual circumstances and market conditions may vary, so exercise caution and judgment when applying the insights discussed in this article.
We all know what the general theory says about moving averages: they are technical indicators used to smooth out price movements and identify market trends. However, we want to take a moment to show you a different perspective on how to use moving averages for market analysis. The best thing is that the approach we give you is fully cyclical, meaning that it can be used to predict future market movements (but always compare your predictions with other indicators to make well-informed decisions).
What Is a Moving Average?
A moving average is a rather easy concept to understand. It is an average price of a security over a specific period, which changes as new data becomes available. For instance, if you take a 20-day simple moving average (SMA) of a stock’s closing prices, the SMA will be recalculated on each trading day using historical data from the previous 20 days. This results in a smoother line that can help identify trends and remove noise from price fluctuations.
Technical Analysis 101 – How to Use Moving Averages
Different lengths of moving averages can be used for different purposes depending on your trading strategies. For instance, you could plot the 25, 50, and 100-day SMAs on a chart and observe how the stock’s price reacts to each one. A crossover of two different length averages can signal buying or selling opportunities, while some traders use multiple moving averages to identify strong trends. It’s also worth noting that SMA and exponential moving average (EMA) are two different concepts. The EMA gives more weight to recent prices, making it more responsive to recent price changes.
The Way We Use Moving Averages to Spot Market Cycles
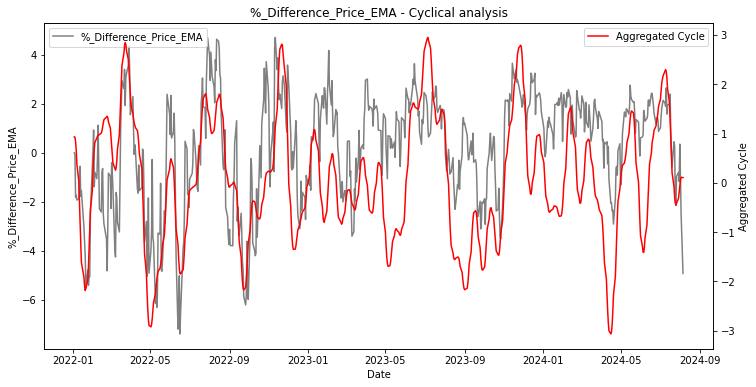
At Cycle Quest, we see moving averages in a slightly different light. If you plot the percentage gap between the price and a moving average on a chart, you will notice an indicator with a mean equal to 0, moving around this value:

If you have been reading our blog for long enough, you’ll be able to see it too: the yellow line above is strongly cyclical, as you can see in this chart. Let us help you spot it by adding the detected cycle to the chart:

This is a critical concept for us. We want to make sure you understand this correctly, as it will be the foundation of our approach.
A Past Prediction with the Exponential Type of Moving Average (EMA)
The nice thing about the cyclical nature of moving averages is that they can be predicted using our algorithms. For instance, take a look at what the algorithm would have predicted on the S&P 500 a few weeks ago:

Note that the black line represents known historical prices of the index, while the blue line is from data that was not available to the model. As you can see, our model accurately predicted a peak in July 2024, followed by a strong decline until September 2024 – which is exactly what occurred. This level of accuracy can greatly benefit your trading strategies if you incorporate cycle analysis into your skillset.
Improve Your Trading Strategies with Cycle Quest
We don’t normally share our premium analyses in free-to-read articles, but let us make an exception here:

As you can guess, the red areas indicate the expected bottoms, while the green ones identify the predicted tops.
The prediction above for the S&P500 is just one example of the power of cycle analysis. By incorporating this technique into your technical analysis, you can potentially increase the success rate of your trades and make more informed decisions.
If you are interested in learning more about how we use moving averages to spot market cycles and improve trading strategies, feel free to contact Cycle Quest via our website.

