If you were able to predict how the unemployment rate changes over time, you would have a valuable tool for making informed decisions about the labor market and economy. The ability to forecast the unemployment rate can help businesses plan for hiring or downsizing, individuals make career choices, and governments implement effective policies. The great thing is that this is possible with cycle analysis.
What Is the Unemployment Rate (and Why You Should Worry About It)
If you are on this page, you’re likely familiar with the concept of the unemployment rate. In fact, skip this section if you already know what it is. For those who need a refresher, here’s a brief definition: The unemployment rate is the percentage of the labor force that is currently unemployed but actively seeking employment. This indicator provides insights into the health of the labor market and the overall economy. A high unemployment rate can indicate an economic downturn, while a low unemployment rate can signal growth and potential inflation.
Insight from Visualizing Unemployment Rate and Its Strong Cyclic Component
Now, let’s take a deeper look at how the unemployment rate moves in a clearly cyclical way. We took the data from the St. Louis Fed database from 1948 to today and plotted it on a graph:
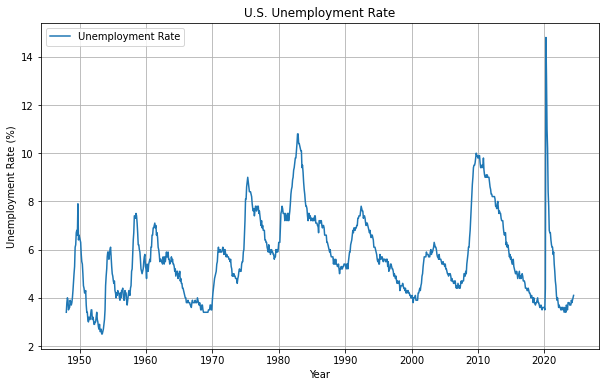
You can see the peaks and bottoms, making it impossible to miss the cyclicality of this economic indicator. Let us highlight these below by adding the detected cycle component:
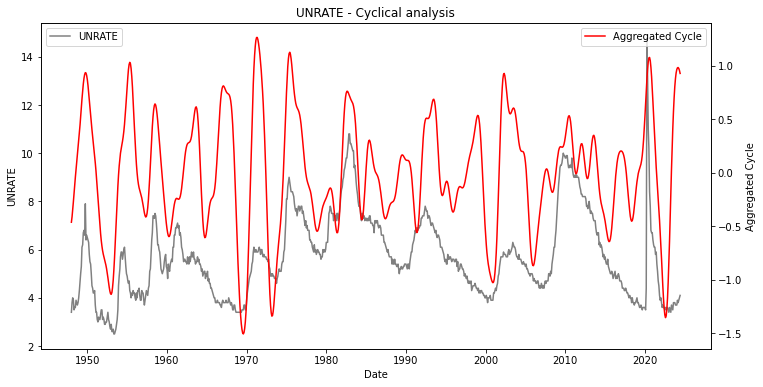
However, predicting these peaks and bottoms is not an easy task (otherwise, economists would be much more precise and popular).
Does It Work? A Look at Past Predictions on This Economic Indicator
The issue with existing research on the unemployment rate is that most authors base their theories on historical data without testing them on unseen data. At Cycle Quest, we aim to provide transparent evidence of how our theory would have worked in the past.
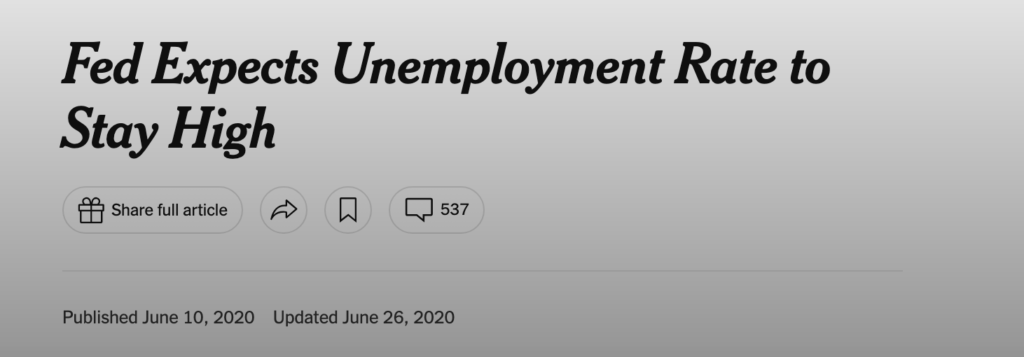
For example, let’s look at June 2020, when the US was facing a high unemployment rate due to the COVID-19 crisis. The Federal Reserve publicly claimed that unemployment would remain high for a “relatively long period:”
Our cycle analysis, however, predicted a quick decline followed by a minor peak (which we are currently experiencing):
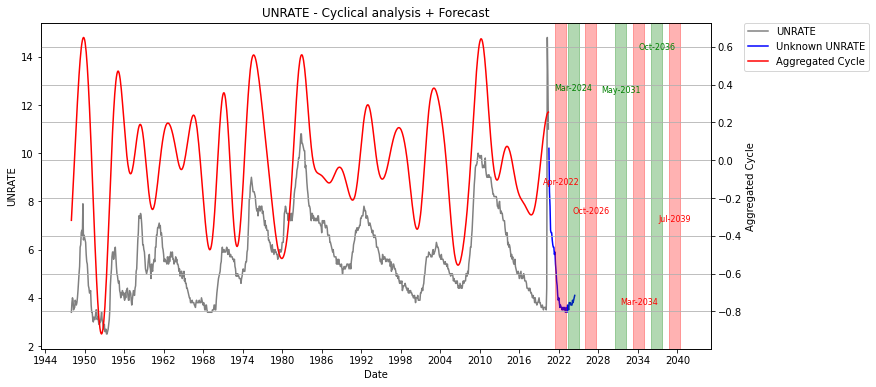
Note the blue line, which represents the information that was now known to the model at the moment of the forecast. The expectation was for an April 2022 bottom (it came later, in the Summer), and a March 2024 peak.
When even central banks are missing the mark, you understand how underrated cycle analysis is. This should be a wake-up call: relying on past data is not enough. There are all sorts of complex mathematical and psychological reasons why cycle analysis works on this economic indicator. However, the main reason is that it takes into account human behavior and how it affects the economy. It’s nothing magic really, it’s just an empirical way to approximate an equation that researchers have not been able to explicitly pin down (for now).
Future Unemployment Rate Forecast
Looking ahead, our latest cycle analysis suggests that the unemployment rate is likely very close to a peak and will reach a bottom around Autumn 2026:
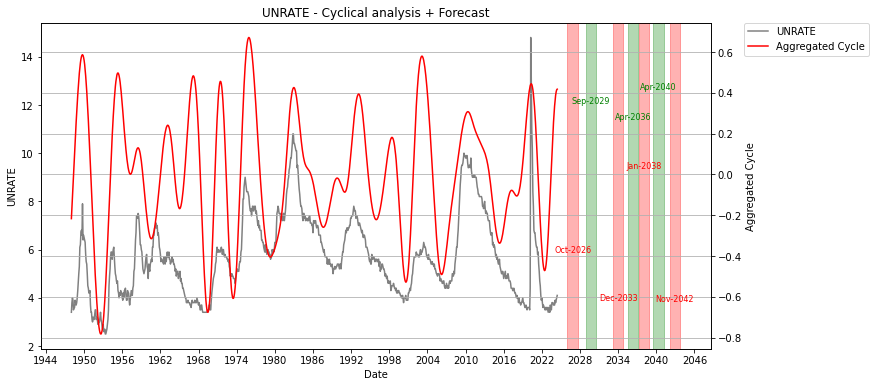
However, there may be another peak in September 2029, when the US economy could face a downturn. This forecast is subject to change as we continue to analyze economic cycles and adjust our predictions accordingly.
Book a Consultation with Cycle Quest
Interested in learning more about how cycle analysis can help you forecast the unemployment rate? Contact Cycle Quest today to schedule a consultation with our team of experts. We can provide personalized insights and guidance for businesses, individuals, and governments looking to make informed decisions based on economic cycles. Don’t miss out on this valuable tool – book a consultation now!
Overall, using cycles for unemployment rate forecast allows for:
- Better understanding of future trends in the labor market and economy
- Preparation for potential economic downturns or growth periods
- Informed decision-making for hiring or downsizing
- Guidance for career choices and government policies
- Transparent evidence of past predictions for validation and improvement.
So why wait? Book a consultation with Cycle Quest today and start utilizing the power of cycle analysis for unemployment rate forecasts. Don’t miss out on this valuable tool – contact us now!
