Disclaimer: The content provided in this article is intended for general informational purposes only and should not be construed as financial advice. The analysis presented is based on cyclical patterns in historical data, which may not be applicable to specific financial situations or investment decisions. Readers are advised to conduct their own research and consult with qualified financial professionals before making any investment or business choices. The author and Cycle Quest shall not be held responsible for any losses, damages, or liabilities resulting from the use of the information presented in this article. Additionally, past performance or historical trends are not indicative of future results. Individual circumstances and market conditions may vary, so exercise caution and judgment when applying the insights discussed in this article.
The way people trade on the stock market can give us valuable insights about market trends and potential future movements. One important metric to consider is trading volume, which measures the number of shares traded during a given time period. Is it possible to predict it? It turns out that cyclical analysis can be a powerful tool in forecasting trading volume and, consequently, market selloffs and bullish phases.
What Is the Trading Volume?
Trading volume is a measure of how much stock or securities are being bought and sold within a specific time frame. It is typically measured on a daily basis and can provide valuable information about the activity and sentiment of investors in the market. Observing its trends and cycles over time can help us gain insights into potential price movements and identify patterns that may affect future market performance.
Bullish vs Bearish – What Daily Trading Volume Can Tell You
Daily trading volume patterns can give us useful indications about market sentiment. Here are some key points to keep in mind when analyzing trading volume:
- High trading volume is often seen during market sell-offs, reflecting heightened activity and uncertainty among investors.
- In contrast, calm bullish movements—typically the “normal” long-term behavior of the stock market—are usually accompanied by lower trading volumes, indicating a more stable and confident market environment.
For now, keep in mind the simple distinction above. It’s actually a bit more complicated than this, but for the sake of this article, you can stick to these 2 points.
Trading Volume Forecasting – A Look at the S&P 500 Over the Years
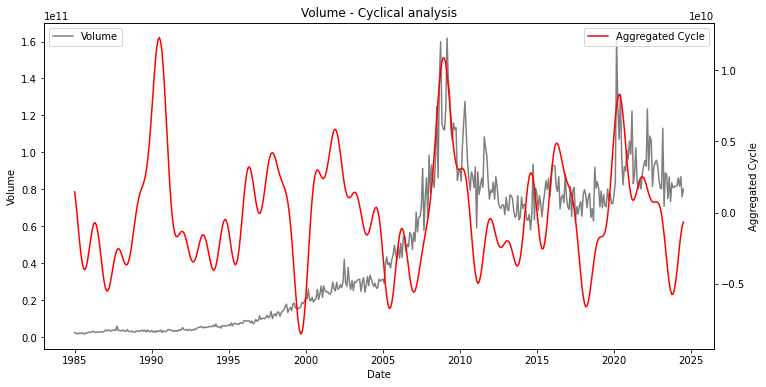
The S&P 500 is one of the most widely used stock market indices and its trading volume data has been extensively studied. Looking at historical data from the 1980s until now, we can clearly see cyclical patterns in its trading volume:

A few key takeaways from this analysis include:
- There is a clear alternation between peaks and troughs in trading volume, indicating long-term cycles at play.
- Peaks in trading volume often coincide with market sell-offs, as investors rebalance their portfolios by selling stocks and moving funds to the bond market. In these phases, a typical stock return will turn negative, no matter how good the underlying company is (because panic is just panic).
- Being able to predict changes in S&P 500 trading volume can also help us forecast bull and bear phases in the market.
Does Cycle Analysis Work? A Look at Past Predictions on the S&P 500 Trading Volume
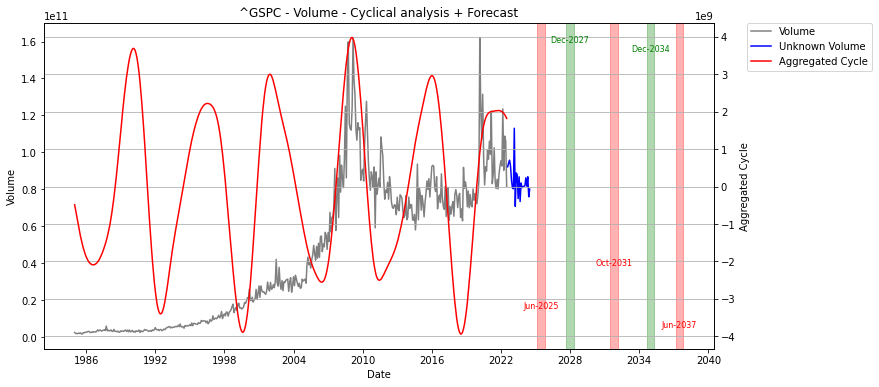
At Cycle Quest, we are transparent about our methods and do not want to sell services that are not necessary for our clients. However, looking at what cycle analysis would have told us two years ago, it’s clear that it can be a valuable tool for predicting trading volume and market trends:

Take a look at the graph above, which shows the S&P 500 trading volume data known to our model (black line) compared with forecasted data (blue line). As you can see, the model accurately predicted a decline in trading volume that occurred over several months.
Predicting Future Trading Volume on the S&P 500
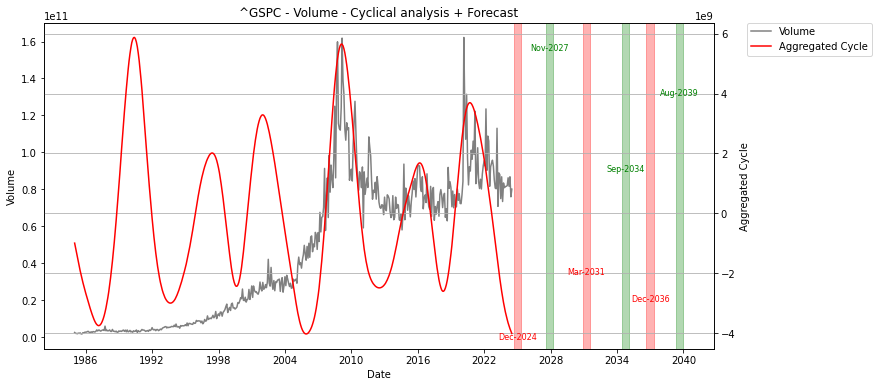
Today, we chose to share with our existing clients and non-paying readers alike a chart showing the future prediction on the S&P 500 trading volume:

Using advanced data analysis techniques such as machine learning, we have identified a cyclical minimum in December 2024, with a peak at the end of 2027. While it may be too early to tell if this will result in a market selloff, it is certainly a strong indication worth considering.
Get Cycle Quest’s Support for Your Trading Volume Predictions
At Cycle Quest, we specialize in cycle analysis and can provide support to investors looking to incorporate this forecasting method into their trading strategies. Technical analysis is not sufficient to trade, as you have probably understood yourself over the years. Contact us today to learn more about our services and how we can help you use cycle analysis for your trading volume predictions.
Frequently Asked Questions about Trading Volume
What is the importance of predicting trading volume with cycles?
Predicting trading volume with cycles is essential for traders and investors as it can help in anticipating market trends, understanding market behavior, and making informed decisions based on volume patterns.
How can machine learning be used to predict trading volume?
Machine learning techniques such as neural networks can be applied to historical data to analyze patterns and forecast future trading volume levels accurately.
What is meant by average daily trading volume?
Average daily trading volume refers to the average number of shares traded in a particular stock or market over a defined period, typically calculated as the total trading volume divided by the number of trading days.
How does time series analysis help in predicting trading volume?
Time series analysis allows traders to examine historical trading volume data, identify trends, seasonality, and cyclic patterns, which can then be used to project future trading volume levels.
What role does stock price play in predicting intraday volume?
Stock price movements can influence trading volume, as price changes often trigger trading activity. Understanding the relationship between stock price and trading volume is crucial for accurate predictions.
How do low volume conditions impact trading strategies?
Low volume conditions can lead to increased volatility and liquidity risks, affecting trading strategies and execution. Traders need to adapt their approaches in response to changes in volume levels.
What is the significance of original research in trading volume prediction?
Original research in trading volume prediction involves developing innovative methods and models to forecast volume accurately, leading to improved trading outcomes and better risk management.

