Disclaimer: The content provided in this article is intended for general informational purposes only and should not be construed as financial advice. The analysis presented is based on cyclical patterns in historical data, which may not be applicable to specific financial situations or investment decisions. Readers are advised to conduct their own research and consult with qualified financial professionals before making any investment or business choices. The author and Cycle Quest shall not be held responsible for any losses, damages, or liabilities resulting from the use of the information presented in this article. Additionally, past performance or historical trends are not indicative of future results. Individual circumstances and market conditions may vary, so exercise caution and judgment when applying the insights discussed in this article.
One of the little-known secrets of stock investing is the way beta, a measure of volatility, can be used to predict future performance. By understanding the cycles of beta and how they relate to stock market trends, investors can gain valuable insights into the behavior of their portfolio and make more informed investment decisions. Today, we’ll give you a short overview of the topic and a quick example to show you how strong the predictive power of beta is when combined with cycle analysis.
What Is Beta?
Beta is a measure of volatility that compares the movement of a stock to that of the overall market. It takes into account factors such as market trends, economic conditions, and company-specific events to show how likely a stock is to move in line with or against the market. A beta above 1 indicates a stock that is more volatile than the market, while a beta below 1 means it is less volatile.
How Do Investors Interpret the Beta of a Stock?
Investors typically use beta as a gauge for systematic risk – the risk inherent in the overall market. The general rule when looking at beta is: if beta > 1, it tends to overperform when the market is bullish, and vice versa. However, there are always exceptions to this rule, as specific events such as company news or industry developments can cause a high-beta stock to diverge from the overall market.
Use Beta and Cycle Analysis
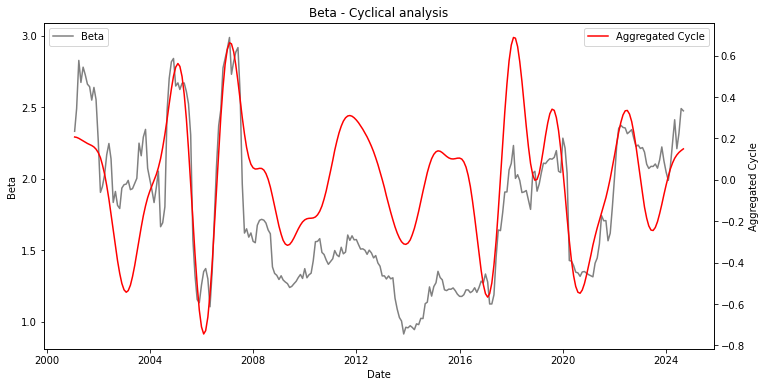
One of the lesser-known concepts in beta analysis is that it changes over time. For example, during financial crises, all stocks will have a beta closer to 1 because these events make financial assets move in similar ways. On the other hand, during recoveries, stocks with historically high beta tend to rise quickly and see their beta increase again. This cyclical nature of beta can provide valuable insights for investors.
Let’s pick, for instance, the historical beta of Nvidia (NVDA) and take a look at how it has moved in a cyclical way:

We’ll elaborate more on this example in the sections below.
A Past Cycle Analysis Prediction on a High Beta Stock
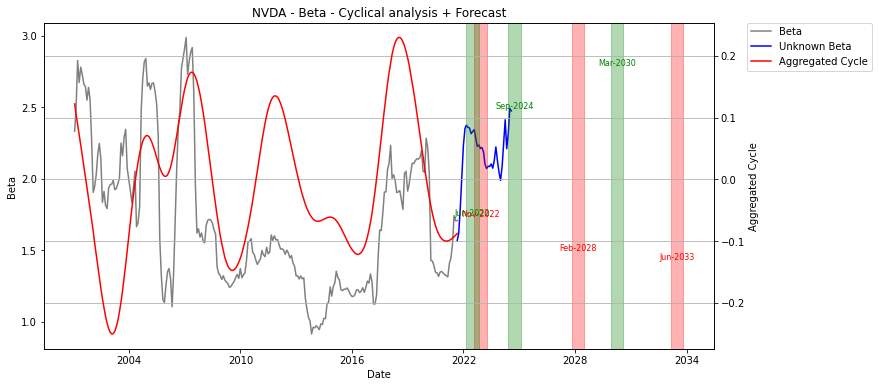
One of the most exciting aspects of cycle analysis is that it can predict future peaks and bottoms with good precision. Let’s stick to NVDA again and go back three years in time. The predictions would have been those you see below:

Specifically, focus on the closest three peaks/bottoms predicted by the model:
- Rising from 1.75 to peak January 2022
- Bottom November 2022
- Peak September 2024
Looking at the blue line, which represents data that was unknown three years ago, we can see that the predictions were accurate for both the peak and bottom in 2022. However, there was an even lower bottom a few months later, which can be considered as “noise” due to the quick movement and subsequent recovery. And the September peak prediction was also onto something, as NVDA’s beta actually showed a strongly upward trend in that period.
Today’s Prediction
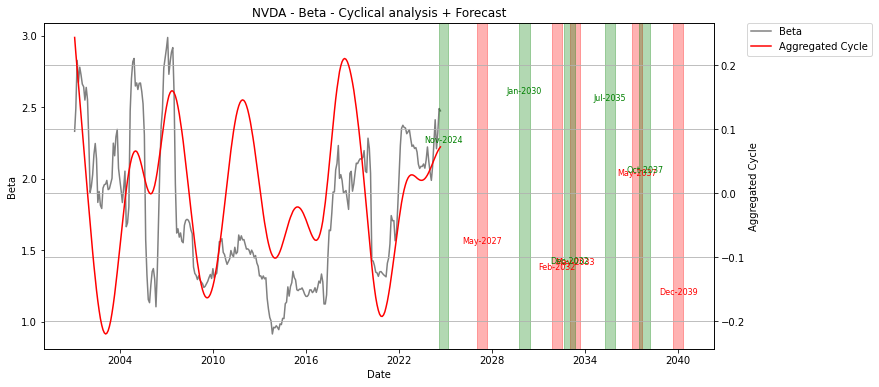
Now, with NVDA currently having a very high beta, cycle analysis is pointing towards a likely peak in September 2024. Interestingly enough, recent data has moved the forecasted peak from September to November 2024 – highlighting how dynamic cycles can be (if you’ve been reading this blog long enough, you’ll be now familiar with the concept that cycles are not static). Here is the detailed prediction:

All you need to know about the chart above is that the green areas represent the predicted future peaks, while the red ones are the expected bottoms.
This is premium information we are sharing for free just as an example. We strongly advise against taking up a trade based on this chart. Beta is not sufficient, by itself, to enter or exit a trade, there are other factors to consider (and they can also be predicted with cycle analysis, by the way).
Using Beta for Portfolio Management – Change the Way You See the Stock Market
By understanding the cyclical nature of beta, investors can use this information to adjust their portfolio accordingly. For example:
- During periods of market downturns or recessions, investors may want to consider shifting towards low-beta stocks, which tend to be less volatile and offer more stability in a bearish market.
- When the overall market is performing well and showing bullish trends, high-beta stocks may provide opportunities for higher returns. However, investors must be mindful of any potential risks or unexpected events that could disrupt this trend.
Include Beta Prediction in Your Portfolio
Beta analysis is often overlooked by beginner investors but is crucial for understanding the behavior of a stock in relation to the overall market.
By combining it with cycle analysis, investors can gain valuable insights into future performance and make more informed investment decisions. As always, it’s essential to do your own research and consult with a financial advisor before making any investment decisions.
Contact our team today for more personalized insights and strategies tailored to your portfolio needs!
Frequently Asked Questions about Stock Beta
What is beta and how is it calculated?
Beta is a measure of a stock’s volatility in relation to the overall market. It is calculated by comparing the stock’s price movements to a benchmark index, such as the S&P 500.
Why do investors use beta?
Investors use beta as a way to evaluate a stock’s risk in comparison to the overall market. It helps them understand how volatile a stock may be relative to market movements.
What does a high or low beta value indicate?
A high beta value indicates that the stock tends to move more than the overall market, while a low beta value suggests the stock moves less than the market.
Can a stock have a negative beta?
Yes, a negative beta means that the stock tends to move in the opposite direction of the market. It indicates an inverse relationship with market movements.
How can one calculate the beta of a stock?
The beta of a stock is typically calculated using the Capital Asset Pricing Model (CAPM), which considers the stock’s historical returns and market risk.
What is the significance of a stock with a beta of 1?
A stock with a beta of 1 moves in line with the market. It represents an average level of volatility in relation to market movements.
How does beta change over time for a stock?
A stock’s beta will change over time based on its price movements and market conditions. Factors such as company performance and industry trends can impact the stock’s beta value.

