If, like us, you have a website, you’ll know that predicting highs and lows in web traffic data has become a vital aspect of your online presence management. Understanding the fluctuating patterns of user engagement can give website owners all the data they need to make informed decisions, optimize content, and improve overall performance.
When it comes to data on new users in Google Analytics, it is crucial to recognize that these statistics are not immune to trends and might require data analytics to better understand their impact. Trends can influence user behavior over time, causing variations in website traffic that go beyond just cyclical patterns. Therefore, while cyclical analysis plays a significant role in identifying recurring cycles and trends of user lifetime activities, it is equally important to consider the broader trend component for a comprehensive analysis.
For this article, we are privileged to have a gracious reader who willingly shared their web traffic data from Google Analytics. We extend our gratitude to them for allowing us to utilize their dataset as a prime example for this discussion.
In the following sections, we will delve into the importance of predicting highs and lows in web traffic data and explore the significance of cyclical analysis in the context of trending datasets. By analyzing the reader’s data, we will demonstrate the potential impact of cyclical analysis in predicting patterns within a dataset that experiences a decreasing trend. However, we must remember that the effectiveness of cyclical analysis is maximized when it is accompanied by an understanding of the underlying trends that shape the data.
Cyclical analysis is a potent tool for predicting the highs and lows of web traffic data. It can reveal recurring patterns that help in optimizing your website and making informed decisions. But remember, it doesn’t work alone. It’s most effective when combined with an understanding of underlying trends in your data.
- While cyclical analysis identifies recurring patterns, it is also crucial to consider the trend component. Distinguishing short-term fluctuations from long-term trends can offer a more comprehensive understanding. So, delve deeper, look beyond the cycle, and see the trend!
If the idea of analyzing cycles and trends in your web traffic data seems overwhelming, don’t worry. Cycle Quest is here to help! With a team of expert advisors, Cycle Quest can guide you through the process, helping you leverage cyclical analysis to its fullest. Contact us today to get started!
Table of Contents
Understanding the Importance of Predicting Highs and Lows on Google Analytics [Google Analytics 4 and More]
In the dynamic world of web traffic data, identifying peak and low periods holds immense significance for website owners and managers alike. By accurately pinpointing these patterns, we gain valuable insights that can have a transformative impact on decision-making and website performance optimization.
At the heart of this importance lies the ability to discern the ebbs and flows of user engagement. Knowing when traffic is expected to surge or dip allows us to strategically plan and allocate resources.
For instance, during high-traffic periods, we can focus on delivering fresh and engaging content, capitalize on marketing efforts, and cater to the increased influx of visitors. On the other hand, during low-traffic periods, we can analyze potential causes and implement targeted improvements to re-engage audiences.
Predicting these patterns goes beyond mere speculation; it serves as a guiding light for data-driven decision-making via google. Armed with the foresight of upcoming fluctuations, website owners can optimize their user experience, streamline marketing campaigns, and make informed adjustments to meet users’ evolving demands.
This is where cyclical analysis plays a pivotal role. By employing cyclical analysis techniques, we uncover the hidden regularities within the web traffic data, enriching your data and offering more insights. These recurring patterns, often obscured by noise and irregularities, hold valuable insights into user behavior and engagement trends. Whether it’s weekly, monthly, or seasonal cycles, understanding these patterns empowers us to adapt and align our strategies accordingly.
Dealing with Trending Data in Cyclical Analysis
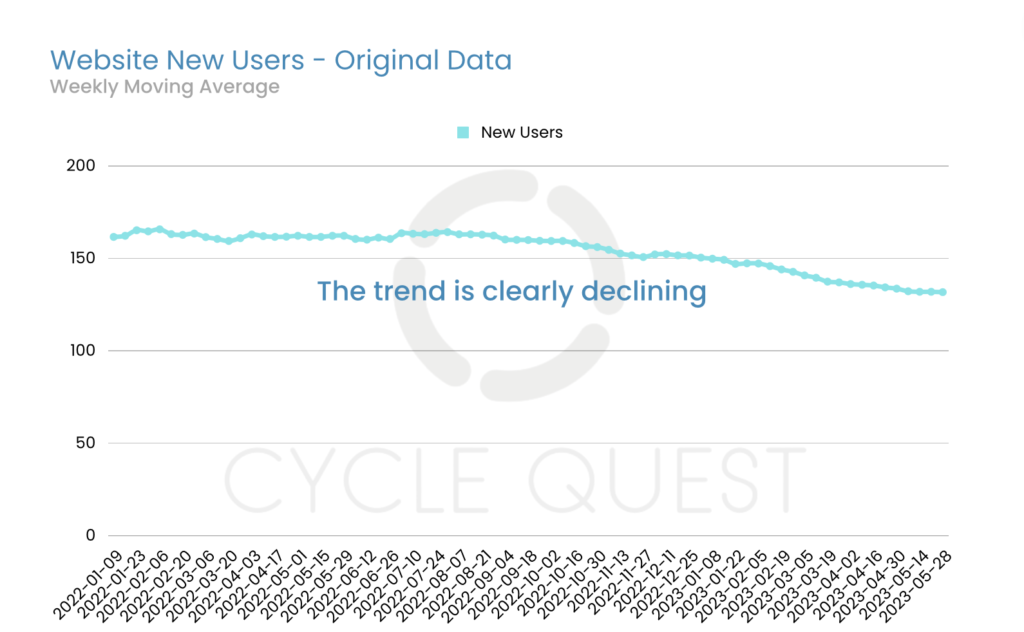
Understanding web traffic data can be tricky to predict future information, especially when it exhibits a noticeable trend over time. In our reader’s dataset, we observed a gradual decrease in traffic, making it essential to handle both trends and cycles carefully.
Source of Web Traffic Data: Google Analytics
To better grasp the impact of trends on the data, let’s take a look at Chart 1 and Chart 2. In Chart 1, we see the raw data, and it clearly shows the overall decreasing trend. This trend might be influenced by various factors, such as changes in user behavior or modifications to the website’s features, which can be analyzed using google analytics 4.
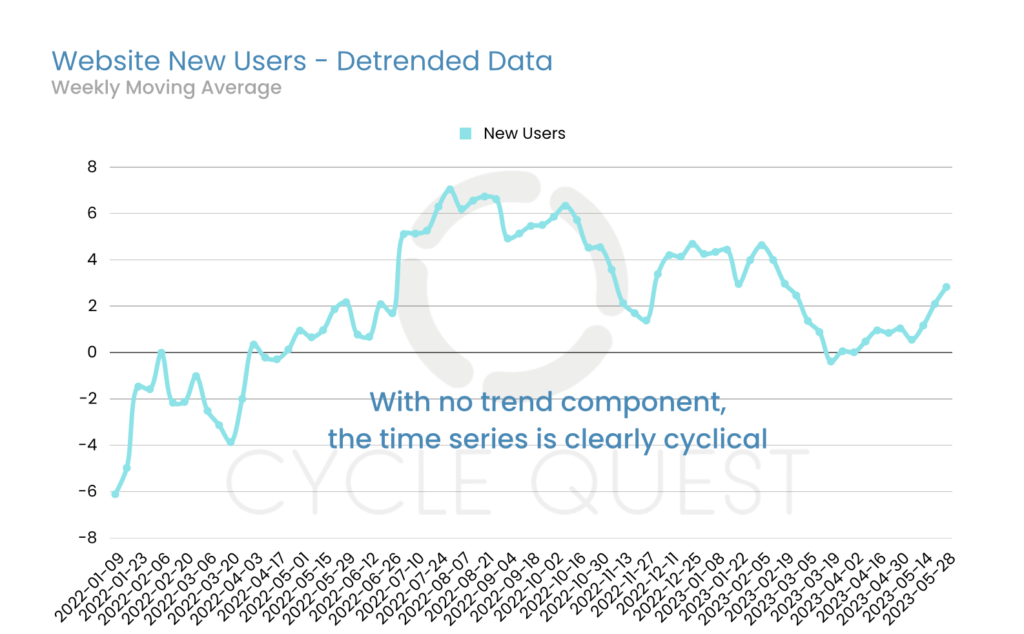
Now, to focus solely on the cyclical patterns, we employ Chart 2, where we have removed the trend component to reveal the cyclical variations more clearly. This detrended version helps us pinpoint the periodic ups and downs without the interference of the overall downward trend.
A Focus on Predictive Analytics
The cyclical analysis will be exclusively performed on Chart 2 because it allows us to concentrate on the recurring cycles independently. By isolating the cyclical patterns, we can gain valuable insights into the periodic fluctuations in user engagement without being influenced by the overarching trend.
By using Chart 2 for cyclical analysis, we can effectively predict and strategize for the cyclic patterns in the data, helping us optimize our website’s performance using data even in the face of a trending decline in overall traffic.
Utilizing Cyclical Data in a Trending Dataset
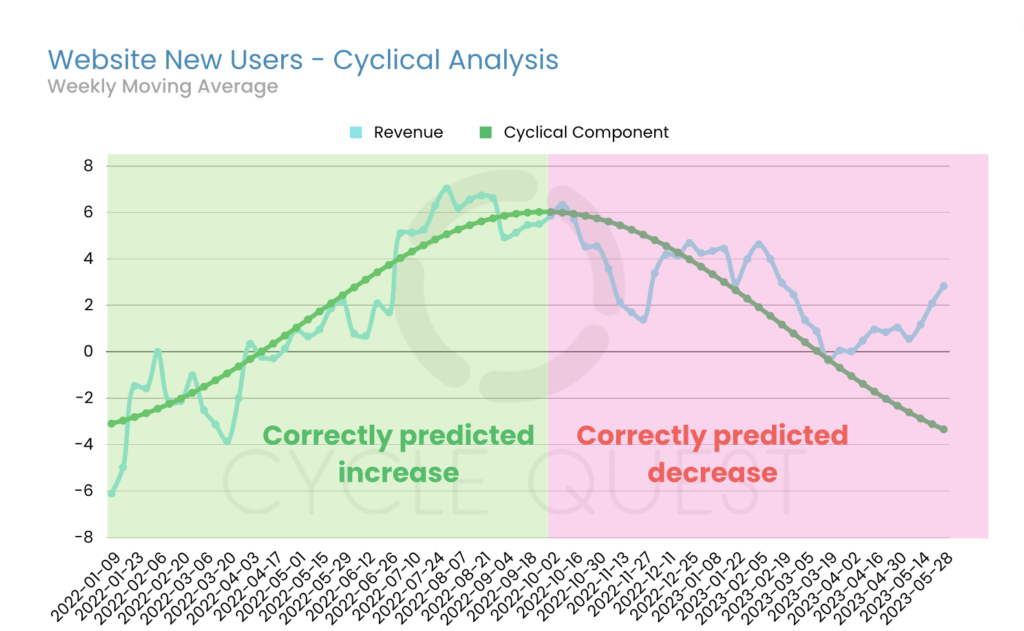
Let’s take a closer look at Chart 3 to see how cyclical analysis can be a game-changer, even in a trending dataset.
Source of Web Traffic Data: Google Analytics
In Chart 3, we’ve overlaid the detected cycles with the upward and downward movements in the dataset. It’s fascinating to observe how these cyclic patterns align with the corresponding fluctuations in web traffic. The green area in the chart represents an accurately predicted increase, while the red area signifies a decrease in traffic.
Keep Your Eyes on the Peaks for Great Digital Analytics
Cyclical analysis proves its worth by accurately predicting a major peak in website traffic. Despite the presence of an underlying downward trend, the cyclical component allows us to anticipate and prepare for periods of heightened user activity. This valuable insight helps us optimize content and strategies during peak times, maximizing user engagement and overall performance.
Leveraging cyclical data empowers us to understand and harness the recurring cycles, providing a clearer picture of user behavior amidst the trend. By recognizing these patterns, we can navigate through the overall declining trend and make data-driven decisions that adapt to the cyclical fluctuations, ensuring continued success for our website, even in the face of broader trends.
Incorporating cyclical analysis in datasets with strong trends enriches your data by bringing an additional layer of understanding. It goes beyond mere trend analysis, providing clarity on short-term fluctuations. By utilizing predictive analytics capabilities, you can forecast future trends accurately. Remember, analytics will stop updating if not properly maintained, so ensure your dataset remains eligible for predictive metrics.
Your Predictive Metric – The Purpose of Incorporating Cyclical Analysis in Strong Trending Datasets
When dealing with datasets that exhibit strong trends, incorporating cyclical analysis serves multiple crucial goals:
Using cyclical analysis in datasets with strong trends enables a more comprehensive understanding of the data, going beyond the scope of simple trend analysis.
Cyclical analysis complements trend analysis by revealing additional insights into the cyclical patterns present in the data.
Understanding cyclical patterns helps distinguish short-term fluctuations from long-term trends, providing clarity in interpreting user behavior and engagement trends.
By integrating cyclical analysis into datasets with strong trends, we uncover hidden layers of information that might be masked by the overarching trend. This multidimensional approach equips us with the tools needed to interpret the complexities of web traffic data, empowering us to tailor strategies that address both short-term cycles and long-term trends effectively.
The Insufficiency of Cyclical Analysis Alone in Trending Datasets [Using Predictive Metrics in the Right Way]
In the context of trending datasets, it is essential to recognize the limitations of relying solely on cyclical analysis:
While cyclical analysis unveils recurring patterns, it must be combined with trend analysis to paint a complete picture by including insights on user lifetime and activity cycles. Ignoring the overall trend component can lead to oversights and misinterpretations.
Relying solely on cyclical analysis can result in incomplete or inaccurate conclusions about the data. Trends play a pivotal role in shaping the data’s trajectory, and neglecting them might lead to flawed predictions.
In order to overcome the limitations, it is advisable to adopt a holistic approach by integrating complementary tools and methods. By considering both cyclical patterns and underlying trends, we attain a more robust and reliable understanding of the dataset.
In scenarios where the downward trend is dominant, as we saw today, an increasing cycle might indicate only a slowdown in the decrease or a sideways movement. Similarly, a decreasing cycle could represent a rapid decline in the indicator under analysis. This highlights the need to contextualize cyclical analysis within the broader trend to avoid misinterpretations.
To draw accurate insights from trending datasets, a balanced approach that combines cyclical and trend analysis is indispensable. Integrating both methodologies empowers us to make well-informed decisions and harness the true potential of the data.
Recognize the limitations of relying solely on cyclical analysis. It must be combined with trend analysis to paint a complete picture. Ignoring trends can lead to incomplete conclusions and flawed predictions. By integrating complementary tools, you drive more sales and maintain robust data governance. GA4 uses advanced methodologies to provide a clearer data to predict user behavior, enhancing your overall strategy.
Need More Help? Contact Us to Use Predictive Analytics on Ga4 Data
At Cycle Quest, we provide bespoke cyclical analysis services designed to cater to the unique requirements of businesses, investors, and those keen to learn, utilizing data from GA4 property and user analytics. Our team of experienced advisors boasts specialization across diverse sectors, ensuring mastery in obtaining and examining the most pertinent datasets. We’re particularly adept at analyzing web traffic data, helping you make the most informed decisions for your business.
Here are the easy-to-follow three steps to get you started with Cycle Quest:

Reach out to us at Cycle Quest, where you’ll discover the transformative power of cyclical analysis and data analytics across a wide range of applications, from business and investment to sports and science.
Let us show you how this powerful tool can unlock the secret cycles within your data, especially in relation to web traffic patterns, giving you the insights to outpace your competition and fine-tune your strategies to perfection.
Frequently Asked Questions on How to Predict Google Analytics Changes
Q: What is the significance of predictive audience in Google Analytics?
A: Cycle Quest utilizes machine learning algorithms to analyze event data and user behavior within the last 28 days, for instance. By predicting the future actions of users within the next 7 days (or more), it helps in forecasting churn probability, purchase probability, and the likelihood of users being active on the website. This is particularly useful when analyzing patterns of users who were active in the last 28 days.
Q: How does Cycle Quest help in predicting website statistics on Google Analytics?
A: Cycle Quest utilizes machine learning algorithms to analyze event data and user behavior within the last 28 days, for instance. By predicting the future actions of users within the next 7 days (or more), it helps in forecasting churn probability, purchase probability, and the likelihood of users being active on the website.
Q: Can Google Analytics 4 property be used for cyclical analysis?
A: Yes, Google Analytics 4 property can be leveraged for cyclical analysis to predict the future behavior of users. By utilizing Google’s machine-learning capabilities, you can determine the probability that a user will be active within the next 7 days based on their interactions within the last 7 days.
Q: How does analytics help in predicting website statistics using Google Cloud?
A: Analytics tools available on Google Cloud allow you to analyze historical data and make predictions about future user behavior. By deploying machine learning models, you can forecast which users are likely to make a purchase or remain active on the website within the next 7 days.
Q: What is the role of churn probability in cyclical analysis on Google Analytics?
A: Churn probability plays a vital role in cyclical analysis as it helps in identifying users who are at risk of not being active within the next 7 days. By predicting churn probability accurately, businesses can implement targeted strategies to retain such users and improve overall retention rates.
Q: How does Cycle Quest utilize Google Ads data for predictive analysis?
A: Cycle Quest integrates Google Ads data into its analysis to enhance predictive modeling. By considering user interactions with Google Ads and website activities, it can predict the likelihood of users engaging with your ads or making a purchase in the future.
Q: Can I use dataset to predict the future behavior of users through Cycle Quest?
A: Yes, you can utilize historical datasets within Cycle Quest to predict the future behavior of users on your website. By applying advanced analytics techniques and machine learning algorithms, you can forecast user actions such as making a purchase, remaining active within the next 7 days, or churning from the platform.

