Disclaimer: The content provided in this article is intended for general informational purposes only and should not be construed as financial advice. The analysis presented is based on cyclical patterns in historical data, which may not be applicable to specific financial situations or investment decisions. Readers are advised to conduct their own research and consult with qualified financial professionals before making any investment or business choices. The author and Cycle Quest shall not be held responsible for any losses, damages, or liabilities resulting from the use of the information presented in this article. Additionally, past performance or historical trends are not indicative of future results. Individual circumstances and market conditions may vary, so exercise caution and judgment when applying the insights discussed in this article.
Experts often say that financial markets can predict the future. The reality is slightly different: financial markets adapt to current information and formulate expectations. They “expect” rather than “predict”. In this sense, cycle analysis can tell us a lot about when the Federal Reserve is more likely to cut its interest rates.
There is evidence that the Federal Reserve may cut interest rates twice in 2024: the first time at the end of the beginning of Autumn, and the second one at the end of the year.
Many stocks (and indexes) show a likely peak that occurred in June, with a bottom likely to occur around September.
Cycle Quest can help you better understand the market’s cycles and enhance your portfolio profit probability.
Table of Contents
Consider the S&P 500
Let’s look at the cycles detected by our algorithm:
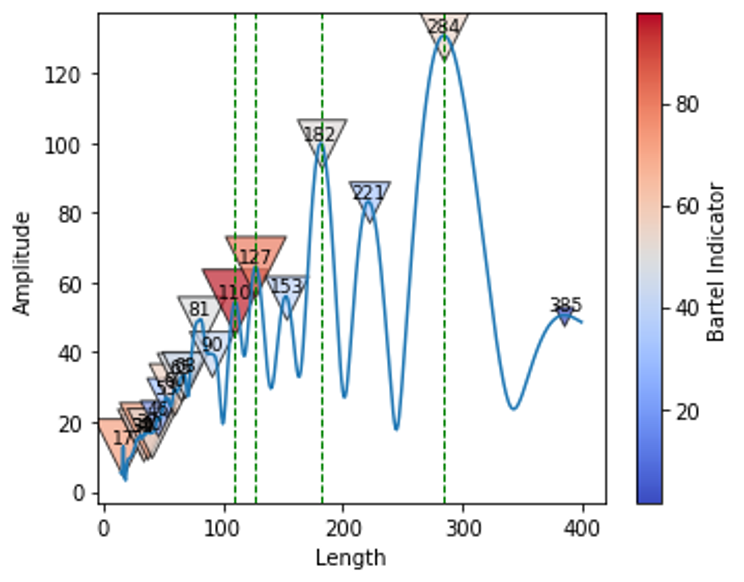
We can see that there are four significant cycles present in the S&P 500 data: 110 days, 127 days, 182 days, and 284 days. These cycles have shown a consistent pattern of reaching a peak and then bottoming out before repeating again.
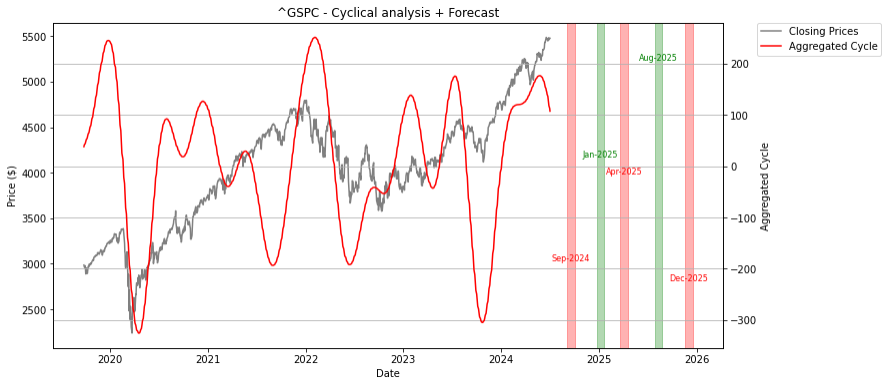
Based on this cyclical analysis, we can expect to see the index reach a bottom around September of 2024 (probably around the first interest rate cut?):
Consider the Wilshire 5000
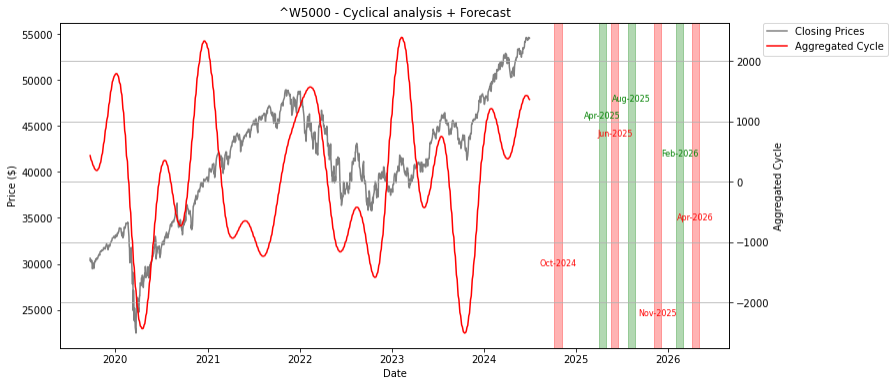
Now let’s look at the cycles found in the Wilshire 5000 index:
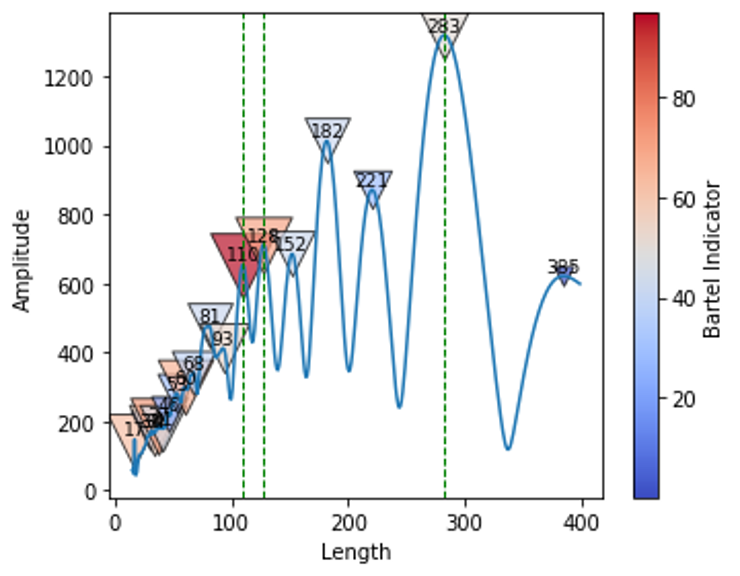
Similar to the S&P 500, we can see three significant cycles in the Wilshire 5000: 110 days, 128 days, and 283 days. This time, we have excluded the 182-day cycle as its impact on the index price seems to be weaker. However, based on these cycles, we can still expect to see a bottom around October of 2024 (yet another hint: the Fed may cut interest rates around that period, with the markets celebrating):
Contact us to discover successful applications of cyclical analysis in various fields such as business, investments, sports, and science. Let Cycle Quest guide you in uncovering the hidden cyclical patterns within your data, helping you gain a competitive advantage and enhance your strategies.
