Disclaimer: The content provided in this article is intended for general informational purposes only and should not be construed as financial advice. The analysis presented is based on cyclical patterns in historical data, which may not be applicable to specific financial situations or investment decisions. Readers are advised to conduct their own research and consult with qualified financial professionals before making any investment or business choices. The author and Cycle Quest shall not be held responsible for any losses, damages, or liabilities resulting from the use of the information presented in this article. Additionally, past performance or historical trends are not indicative of future results. Individual circumstances and market conditions may vary, so exercise caution and judgment when applying the insights discussed in this article.
Forex trading is popular, but that does not mean it is easy. Have you found yourself losing money too many times on the wrong trade? Maybe, you used the right indicators but did not look at them with cycles on your mind.
What is the Best Technical Indicator in Forex?
When it comes to technical indicators in forex trading, price action should be your guide. This means focusing on the movement of prices rather than relying solely on lagging indicators like RSI, MACD and Stochastic.
One simple yet effective indicator to start with is a 20-day moving average (MA). Unlike other technical indicators, an MA can provide real-time data without much lag. And within MAs, there are two types – Simple Moving Average (SMA) and Exponential Moving Average (EMA). The EMA is considered to be more accurate as it prioritizes recent price movements over historical ones.
Price Action: Begin with a Moving Average (and Forget About RSI, MACD, Stochastic, etc.)
“Price action” is a term you often hear in the forex trading world. It refers to analyzing price movements and patterns rather than relying on indicators.
If you are like us, you will follow more or less this reasoning:
- You locate a new cool indicator on TradingView and add it to your chart
- You’ve seen hundreds of different indicators over the years, and you’re used to spotting the phases in which the indicator did not work
- With frustration, you remember that you’ve never found an indicator that works all the time
The reason is simple: indicators are lagging. They’re only based on past data and can’t predict future price movements.
That’s where price action comes in. By analyzing the pure movement of prices, you can get a better understanding of market trends and potential trading opportunities. And a simple moving average can be your best starting point in this process. Or, actually, you could consider an exponential moving average, as we tell you below.
SMA vs EMA
The main difference between SMA and EMA lies in their calculation method. While SMA uses a simple average of prices, EMA gives more weight to recent data points. This means an EMA will respond faster to changes in the market compared to an SMA.
Furthermore, the EMA is better suited for short-term trading while the SMA works well for long-term trends. So depending on your trading strategy, you can choose which MA best suits your needs.
Let’s start with an example. This is what the 20-day EMA would look like for the USD/JPY pair:
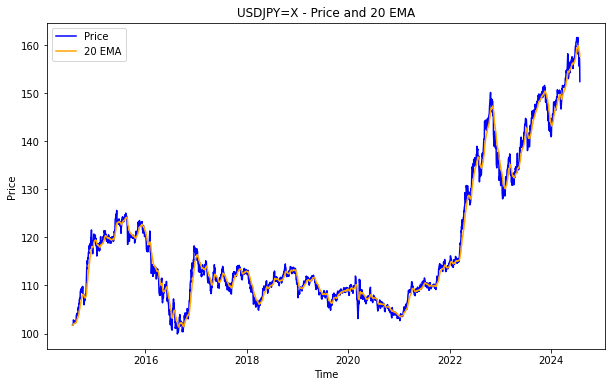
Note how the yellow line (our EMA) is always really close to the actual USD/JPY price. We like the idea of using a 20EMA and not a longer one because, you know what? The 20-day EMA is fast enough to have very little lag. But it also has a slow component. And the nice thing about moving averages in general is that they can help you visualize market trends and potential reversals.
Learn to Compute the Slope of the EMA (The Best Forex Indicator)
But what makes the EMA truly stand out as the best forex indicator is its slope. The slope of an EMA represents its rate of change and can provide valuable insights into market trends.
Simply put, the slope of the EMA indicates whether prices are trending upwards or downwards. When the slope is positive, it means prices are on an uptrend, and when it’s negative, prices are on a downtrend. And since markets move in cycles, this information can be used to predict future price movements.
Add Bollinger Bands to the EMA Slope
To further evaluate how fast (or slow) the EMA slope is moving, you can add Bollinger Bands to the slope. These bands act as volatility indicators and help identify when a trend may be coming to an end.
Bollinger Bands (BB) consist of three lines – a simple moving average (SMA) as the middle line, and two outer lines that are calculated based on standard deviations from the SMA. When prices move towards the outer bands, it can indicate overbought or oversold conditions in the market.
This is what our indicator will look like:
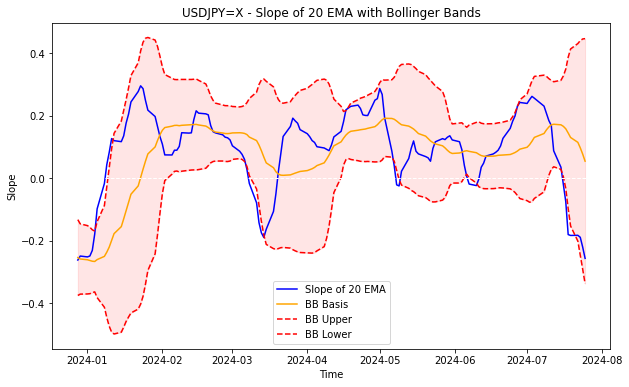
Note how the blue line (the slope of the 20-day EMA) is normally within the bands. A move outside these bands represents a period of strong trend, but the blue line will eventually mean-revert.
View Forex Trading as a Cyclical Movement in the EMA Slope
Now let’s put our trick into action. By looking at the chart of the EMA slope, one can easily observe its cyclical nature. All we see are peaks and troughs, indicating potential trends in the market.
Again, let’s go back to the USD/JPY pair. Look at how cyclical the slope is:
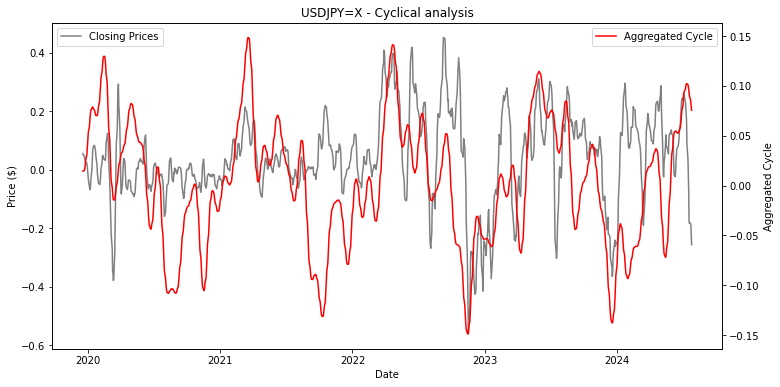
Keep this in mind: cycle analysis does not care about predicting how high or how low a time series will go. Instead, it will tell us when these tops and bottoms are more likely to occur. And if you look at the chart above, we’re dealing with a very accurate prediction. Of course, cycles are dynamic, and you will need to perform and re-perform the analysis over time while trading.
This cycle analysis can be extremely helpful for traders to understand when to buy or sell a currency pair. By following the EMA slope and its cyclical movements, traders can make more informed trading decisions.
Are You a Trader? Receive Tailored Analyses on the Best Forex Trading Indicator
At Cycle Quest, we specialize in providing tailored reports on cycle analysis for various technical indicators, including the 20-day EMA. Our reports help forex traders gain valuable insights into market cycles and make better trades based on this information.
In fact, using the cycles mentioned above, you can predict where the next tops and bottoms will be for the 20-day EMA slope:
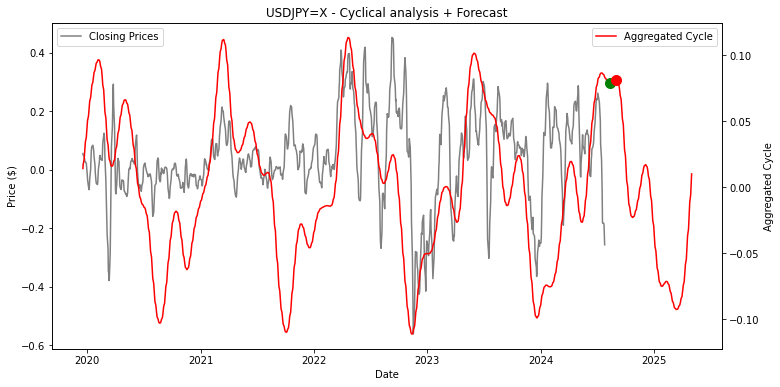
Note that this is nothing more than a statistical tool: it will never know what the Federal Reserve or the Bank of Japan are up to. But the slope of the EMA will certainly help you make informed decisions while trading in the forex market. Trading by exclusively taking cycles into account is not enough. What you want to do here is to add cycle analysis to the existing tools you already possess.
So if you’re looking to improve your trading strategy with reliable cycle analysis, let us be your guide. Sign up with Cycle Quest today and take your forex trading to the next level. Remember, in forex trading, it’s all about understanding market cycles and using the best technical indicators to make informed trades. Contact us to learn more.
Frequently Asked Questions about the Best Forex Indicators
What are the top 10 forex indicators every trader should know?
The top 10 forex indicators include Fibonacci, Relative Strength Index (RSI), Average True Range (ATR), Parabolic SAR, Divergence, Ichimoku, MACD, Stochastic Indicator, Support and Resistance Levels, and the Ichimoku Kinko Hyo indicator.
How can I use forex indicators in trading?
Forex indicators are tools used in technical analysis to help traders make informed decisions. They can be used to identify trends, determine entry and exit points, set stop losses and take profits, and analyze market conditions.
What is the best indicator to use in the forex market?
The best indicator to use in the forex market can vary depending on your trading strategy and preferences. Some popular indicators include Fibonacci, RSI, MACD, and Ichimoku.
Why is Fibonacci considered an important indicator for forex traders?
Fibonacci levels are used by traders to identify potential reversal points in the market. The Fibonacci retracement levels are based on mathematical ratios that are believed to represent key levels where price may change direction.
What is divergence in forex trading?
Divergence in forex trading occurs when the price of a currency pair moves in the opposite direction of the indicator. This can signal a potential shift in the trend or momentum of the market.
How can I identify accurate forex indicators?
Accurate forex indicators are those that provide reliable signals and help traders make informed decisions. Look for indicators that are well-tested, widely used, and align with your trading strategy.
Why are average true range (ATR) and parabolic SAR important for forex traders?
Average True Range (ATR) helps traders measure market volatility, while Parabolic SAR can help identify potential trend reversals. Both indicators are valuable tools for setting stop losses and determining the strength of a trend.
