Disclaimer: The content provided in this article is intended for general informational purposes only and should not be construed as financial advice. The analysis presented is based on cyclical patterns in historical revenue data, which may not be applicable to specific financial situations or investment decisions. Readers are advised to conduct their own research and consult with qualified financial professionals before making any investment or business choices. The author and Cycle Quest shall not be held responsible for any losses, damages, or liabilities resulting from the use of the information presented in this article. Additionally, past performance or historical trends are not indicative of future results. Individual circumstances and market conditions may vary, so exercise caution and judgment when applying the insights discussed in this article.
In the dynamic world of finance and business, understanding the underlying patterns that influence revenue is a crucial element for making informed decisions. Among these patterns, cyclical analysis stands as a powerful tool, allowing us to uncover the rhythmic rises and falls in revenue data. As we embark on our analytical journey with Cycle Quest, we turn our attention to one of the tech industry’s giants, IBM, to unravel the cyclical nature of its revenue.
IBM’s rich history and position as a prominent player in the technology sector make it an ideal subject for this examination. Throughout the years, IBM has navigated various market conditions and economic landscapes, experiencing fluctuations that might hold valuable insights for investors, stakeholders, and business strategists.
In this article, we delve into the world of cyclical analysis and explore IBM’s historical revenue to shed light on the presence and significance of cyclical patterns. Through a combination of data-driven techniques and backtesting, we aim to validate the cyclical nature of IBM’s revenue both in the short term and over extended periods. Moreover, we’ll demonstrate how cyclical analysis can potentially anticipate future ups and downs, providing a fresh perspective on predicting revenue trends.
By leveraging cyclical analysis, businesses can gain a better understanding of how revenue tends to fluctuate over time
Backtesting cyclical analysis provides valuable insights into the underlying patterns influencing business performance. It allows decision-makers to prepare for periods of growth or downturns and make strategic decisions that align with the cyclical nature of the business environment
To make the most of the insights gained from cyclical analysis, businesses can partner with Cycle Quest, a specialized consultancy offering extensive data and periodic reporting to understand and predict revenue trends. With their expertise in leveraging cyclical analysis, businesses can benefit from improved accuracy of predictions and informed decision-making capabilities. Contact us to begin your journey.
Table of Contents
Understanding Cyclical Analysis
Cyclical analysis is a powerful method used in finance and economics (and many other fields) to identify recurring patterns and trends within financial data. By examining historical data, cyclical analysis aims to uncover regular cycles of growth and contraction that can significantly impact a company’s revenue, profitability, and overall performance.
Distinguishing Cyclical Patterns from Seasonal or Secular Trends
Before delving deeper into cyclical analysis, it is essential to differentiate cyclical patterns from seasonal and secular trends. Seasonal trends are short-term patterns that repeat regularly within a year and are often influenced by factors like weather, holidays, or specific events. For instance, retail companies may experience higher revenues during the holiday season.
On the other hand, secular trends represent long-term shifts in data, reflecting underlying changes in the economy, industry, or consumer behavior. These trends can last for years or even decades and may not have a specific pattern of repetition.
Cyclical patterns, however, are intermediate-term fluctuations that typically extend beyond one year but repeat at irregular intervals. They arise due to changes in economic conditions, market dynamics, or business cycles. Unlike seasonal trends, cyclical patterns are not bound to specific timeframes and can exhibit varying durations.
Relevance of Quarterly Data for Cyclical Analysis
Quarterly data is particularly relevant for cyclical analysis as it provides a balance between capturing shorter-term fluctuations and smoothing out the noise present in monthly data. Utilizing quarterly data allows analysts to identify broader patterns that might be obscured by monthly volatility while still offering a more granular view compared to annual data.
Moreover, many businesses report their financials on a quarterly basis, making it a readily available data format. The availability of quarterly reports facilitates the analysis of recent trends and enables timely decision-making for businesses and investors.
Furthermore, cyclical analysis with quarterly data provides a useful perspective for understanding the cyclicality of a company’s revenue generation and its sensitivity to changes in the economic environment. By identifying the timing and magnitude of cyclical patterns, businesses can adapt their strategies to capitalize on opportunities during upswings and mitigate risks during downturns.
In the upcoming sections, we will apply the principles of cyclical analysis to IBM’s historical revenue data, using quarterly data to uncover meaningful insights into the cyclical nature of the company’s financial performance. By doing so, we aim to demonstrate the relevance and significance of cyclical analysis in understanding revenue trends and making informed business decisions.
Identifying the Cyclical Component in IBM Revenue
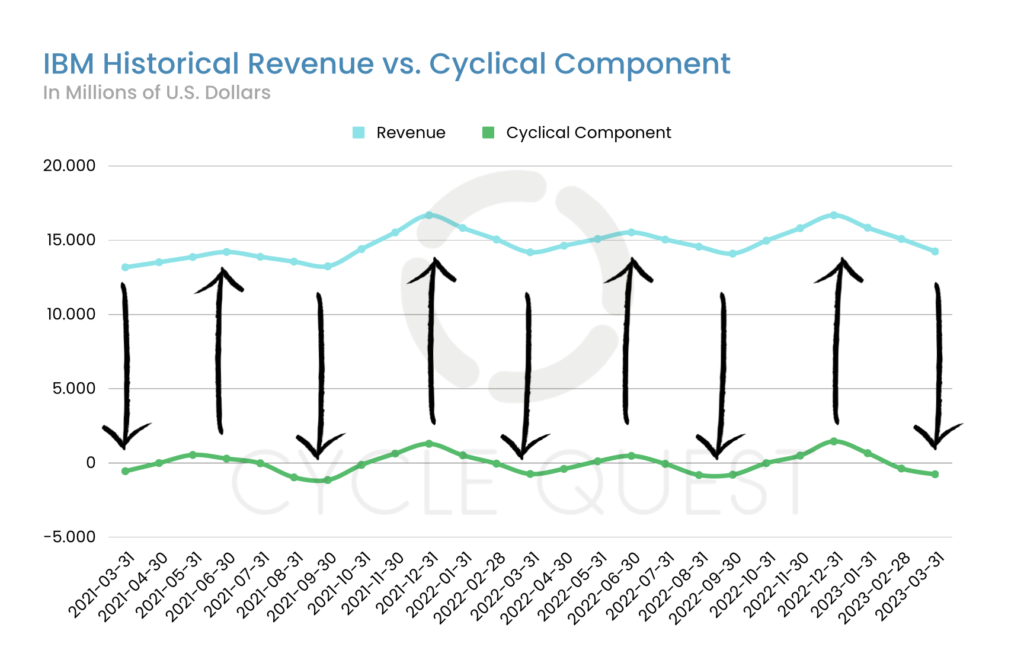
In this section, we turn our attention to a closer examination of IBM’s quarterly revenue trends over the last two years, spanning from March 2021 to March 2023. The first chart vividly illustrates the revenue trajectory during this period, offering valuable insights into the cyclical nature of IBM’s financial performance.
Visual Representation and Noticeable Cyclical Patterns
The chart depicts the quarterly revenue data as a time series, showcasing the fluctuations in IBM’s revenue over the specified timeframe. Upon closer observation, we can discern a conspicuous pattern characterized by alternating ups and downs that recur at regular intervals.
Highlighted by the upward and downward arrows in the image, this cyclical component of IBM’s revenue is evident. The alternating rises and falls form what appears to be a recurring cycle, demonstrating the company’s susceptibility to periodic influences. These cycles are not driven solely by external factors or seasonal events, but they seem to be intrinsic to IBM’s revenue generation process.
The presence of such cyclical patterns opens up intriguing possibilities for stakeholders and investors. Understanding the underlying rhythm can provide valuable insights into the factors that drive these fluctuations, potentially enabling proactive decision-making and risk management.
From Short-term to Long-term Cyclical Validity
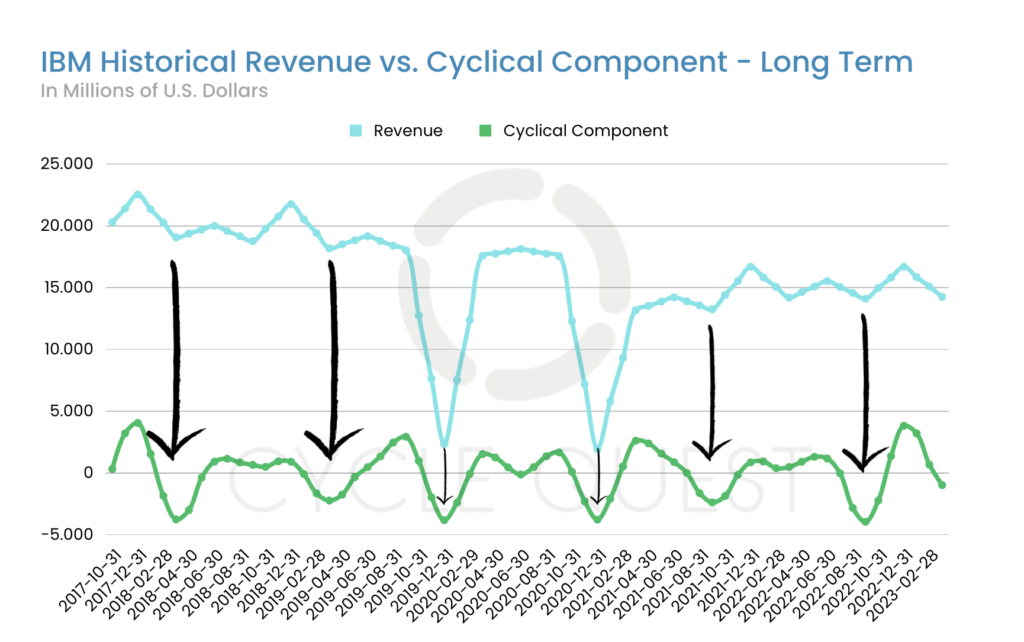
In this section, we extend our cyclical analysis beyond the last two years and broaden our perspective by examining over five years of IBM’s revenue data. The second chart showcases the quarterly revenue trends of IBM, allowing us to validate the cyclical patterns identified in the previous section and explore their relevance over a more extended period.
Visual Representation and Short-term Cyclical Validity
The chart displays IBM’s quarterly revenue data over a 5-year timeframe, enabling us to observe revenue fluctuations from a more comprehensive viewpoint. Upon analyzing the data, we find that the cyclical patterns identified in the short-term analysis (as discussed in Section 2) remain notably consistent over this longer period.
The recurring cycle of alternating ups and downs continues to manifest, reflecting the inherent cyclicality of IBM’s revenue generation process. This consistency in the cyclical patterns provides evidence of the short-term cyclical validity we observed earlier. The fact that these patterns persist over an extended timeframe lends further credibility to their significance.
Aiding Tactical Decision-making for Stakeholders
Combining short-term and long-term cyclical analyses offers a robust approach to tactical decision-making for stakeholders. Short-term cyclical analysis enables businesses to identify and adapt to immediate revenue fluctuations, responding swiftly to changing market conditions. This tactical view empowers companies to optimize their operations, manage inventory, and adjust sales and marketing strategies based on current cyclical trends.
On the other hand, long-term cyclical analysis provides strategic insights into the company’s position within the broader economic context. By identifying multi-year cycles, stakeholders can discern macroeconomic influences that impact the company’s revenue performance. Such knowledge allows businesses to align long-term planning and investments with the cyclical nature of the industry or market, anticipating potential challenges and opportunities.
The combination of short and long-term cyclical analysis equips stakeholders with a comprehensive understanding of IBM’s revenue trends, offering a well-rounded view of its business landscape. Armed with this knowledge, decision-makers can make data-driven choices to enhance operational efficiency, optimize resource allocation, and align growth strategies with the cyclical patterns of revenue.
Backtesting Cyclical Analysis on IBM Revenue
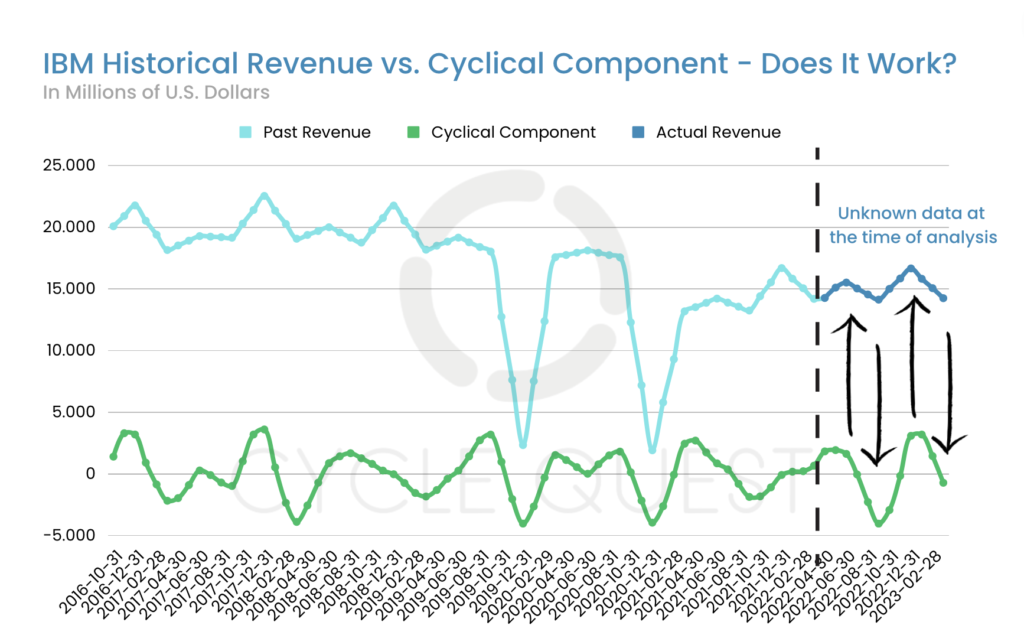
Backtesting serves as a critical tool in validating the efficacy of cyclical analysis by simulating real-world conditions and testing the accuracy of predictions. In this section, we apply backtesting to our cyclical analysis of IBM’s revenue, reproducing the analysis by excluding the final part of the dataset. We then ask our model to predict the omitted revenue values to assess its predictive capabilities.
The third chart showcases the backtesting comparison of predicted cyclical trends with the actual IBM revenue data during the excluded period.
Backtesting Comparison of Predicted and Actual Revenue Trends
The chart presents two distinct lines – one representing the predicted revenue values based on the cyclical analysis and the other reflecting the actual revenue data for the omitted period. The striking aspect of this comparison is the remarkable alignment between the predicted and actual revenue trends.
Accuracy of Predictions and Insights Gained
The backtesting process demonstrates that all the ups and downs in revenue were correctly predicted by our cyclical analysis. The model’s ability to forecast revenue fluctuations with such precision offers valuable insights into the underlying cyclical patterns influencing IBM’s revenue.
By accurately capturing the cyclicality in revenue fluctuations, the cyclical analysis provides decision-makers with a reliable tool for anticipating revenue trends. This empowers stakeholders to prepare for periods of growth or downturns, thereby enabling them to make strategic decisions that align with the cyclical nature of the business environment.
Value of Cyclical Analysis in Understanding Revenue Fluctuations
The success of backtesting reaffirms the value of cyclical analysis in understanding revenue fluctuations. Unlike other forms of analysis, cyclical analysis focuses on uncovering the cyclical patterns that transcend short-term volatility and seasonal influences.
By grasping the inherent cyclicality in revenue data, businesses gain a deeper comprehension of the underlying drivers of revenue performance. Armed with this knowledge, they can optimize financial planning, budgeting, and forecasting, accounting for both periods of expansion and contraction in revenue.
Moreover, cyclical analysis aids in risk management by highlighting potential revenue downturns, allowing businesses to take proactive measures and cushion themselves against adverse economic conditions.
Predicting Future Ups and Downs in IBM Revenue
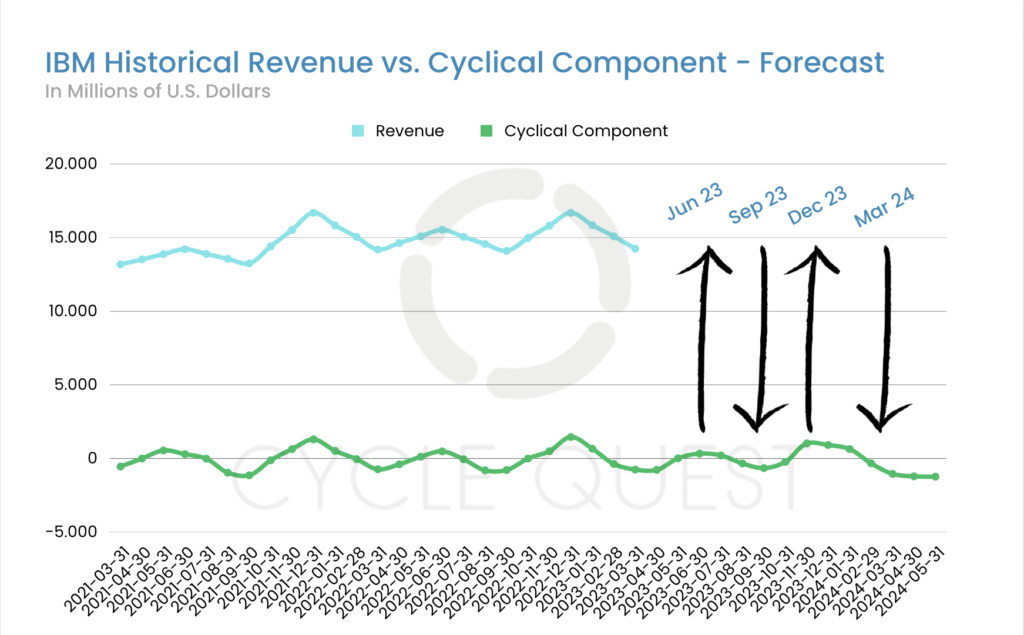
As we have established the cyclical nature of IBM’s revenue trends, we now turn our attention to the potential of cyclical analysis in predicting future revenue ups and downs. In this section, we present a forecast of IBM’s revenue for the next four quarters, extending until March 2024, based on the identified cyclical patterns.
Forecasting IBM Revenue Using Cyclical Analysis
The fourth chart displays the forecasted revenue values for the upcoming four quarters, generated using the cyclical patterns identified in the historical revenue data. The forecast takes into account the cyclicality observed over the analysis period, aiming to project the potential ups and downs in IBM’s revenue for the specified timeframe.
Uncertainties and Risks in Using Cyclical Analysis for Future Predictions
Forecasting future revenue using cyclical analysis carries inherent uncertainties and risks. Economic and market conditions can undergo unforeseen shifts, disrupting the cyclical patterns observed in the historical data. External factors such as changes in consumer behavior, technological innovations, or geopolitical events can all play a role in altering revenue trends.
Moreover, cyclical analysis alone may not account for other significant influences on revenue, such as one-time events, strategic decisions, or changes in competition. Therefore, relying solely on cyclical analysis for future predictions could lead to incomplete assessments.
In order to mitigate risks, it is essential for decision-makers to consider a holistic approach, incorporating various data sources and market indicators. By combining cyclical analysis with fundamental analysis, market trends, and expert insights, stakeholders can form a more comprehensive view of potential revenue fluctuations.
Remember that this article does not represent financial advice. We recommend that you consult with a licensed financial advisor before taking any action. Cyclical analysis can be a great tool in your investment kit, but it cannot be used as the only source of data.
Cycle Quest – Your Partner in Cyclical Analysis
If you and your company are looking for a comprehensive understanding of revenue fluctuations, Cycle Quest offers personalized cyclical analysis services to meet your needs. Our experienced team of advisors can provide tailored insights into various industries through detailed data sourcing and analysis.
The process is extremely straightforward, as we summed up below:


Unlock the hidden potential of your data by leveraging Cycle Quest’s expertise in cyclical analysis. Our team has helped clients from various industries, such as business, investments, sports, and science, to make the most of their data through successful applications of cyclical analysis. With our guidance, you can identify and utilize the cyclical patterns within your data to gain a competitive advantage and refine your strategies. Contact us today to get started!

